Quest Diagnostics Inc (NYSE:DGX) may be encountering what you might call a post-earnings digestion dance. Initially, DGX stock jumped higher, perhaps due to the algorithms and retail traders responding in unison to the better-than-expected results for the second quarter. But the next day, the security slipped, possibly as fund managers more carefully digested the underlying conference call and guidance. Now, DGX is moving steadily higher again.
You got to let the market speak for itself, which will tell you where it may head next. Rather than mere opinions, though, we can use science to decipher clues regarding DGX stock.
First, let's review the numbers. In the second quarter, Quest reported sales of $2.76 billion, beating the consensus estimate of $2.73 billion. This tally also represented a 15.2% lift from the year-ago period. On the bottom line, adjusted earnings per share landed at $2.62, up 11.5% against the prior year and also beating analysts' target of $2.58.
Jim Davis, chairman, CEO and president articulated that demand for the company's clinical solutions and growth in enterprise accounts helped boost the overall top line.
Initially, investors greeted the financial figures with a strong push into DGX stock. However, the caveats centered on politics. During the earnings conference call, management admitted that Quest experienced some negative impact from tariffs and anticipates related turbulence through the third and fourth quarters.
In addition, the leadership team disclosed concerns about the Protecting Access to Medicare Act (PAMA). If it is not deferred for another year, Quest would absorb a financial impact to the tune of approximately $100 million.
Even so, Quest revised its 2025 revenue guidance from $10.7 billion to $10.85 billion to a range between $10.8 billion and $10.92 billion. Further, this forecast exceeded analysts' consensus expectation of $10.79 billion.
Immediately following the earnings disclosure, DGX stock hit a peak of $179. Currently, the security is about 4% lower than this high point. The loose assumption, though, is that because nothing fundamentally changed in the last two days, DGX can return to this perch.
Bringing Empiricism Into The Mix For DGX Stock
To be brutally blunt, if I drew some lines on a chart — perhaps adding a green arrow pointing up — very few people would question the earlier assertion: since DGX stock at first reached $179, it can do so again. It sounds reasonable, maybe plausible. However, it's also a presuppositional fallacy because I would be assuming that a) the market was "correct" in its initial reaction and b) that the move higher is repeatable.
These are quite extraordinary claims and they require extraordinary evidence.
To better understand DGX stock, we must consider the underlying objective truth. Personally, I don't consider Quest beating earnings results or DGX hitting $179 as truthful statements. Instead, these are facts. Further, these facts aren't as useful as they may seem because they are scalar, unbounded signals. They are not defined and therefore, I would say that it's impossible to extract truth from them.
Sounds ridiculous? Quest beat earnings expectations but are those results objectively good? No, it's a relative concept.
As far as I can tell, the only objective truth is this: at the end of the day, the market is either a net buyer or a net seller.
Based on this truthful framework, let's consider the trailing two months. DGX stock has printed four up weeks, six down weeks, with an overall downward trajectory across the 10-week period. We can abbreviate the sequence as "4-6-D."
Sure, at first glance, this classification seems awfully simplistic, perhaps even stupid. But consider what we have accomplished — we converted a messy pricing mechanism into a discrete, defined categorization. We can now look back in time to see how the market historically responds to the 4-6-D sequence relative to other signals.
Conducting the above exercise (going back to January 2019) across rolling 10-week intervals gives us the following demand profile:
| L10 Category | Sample Size | Up Probability | Baseline Probability | Median Return if Up |
| 2-8-D | 6 | 66.67% | 54.68% | 4.92% |
| 3-7-D | 19 | 52.63% | 54.68% | 2.62% |
| 4-6-D | 40 | 70.00% | 54.68% | 1.92% |
| 4-6-U | 17 | 41.18% | 54.68% | 1.11% |
| 5-5-D | 28 | 57.14% | 54.68% | 2.55% |
| 5-5-U | 44 | 59.09% | 54.68% | 1.82% |
| 6-4-D | 18 | 55.56% | 54.68% | 3.20% |
| 6-4-U | 59 | 54.24% | 54.68% | 1.43% |
| 7-3-U | 56 | 44.64% | 54.68% | 1.41% |
| 8-2-U | 25 | 64.00% | 54.68% | 1.00% |
Notably, the 4-6-D sequence flashed 40 times over the past six-and-a-half years. In 70% of cases, the following week's price action results in upside, with a median return of 1.92%. Importantly, the upside odds handily beat the baseline probability of 54.68%. Should the bulls maintain control of the market for a second week, the median performance is an additional 1.96%.
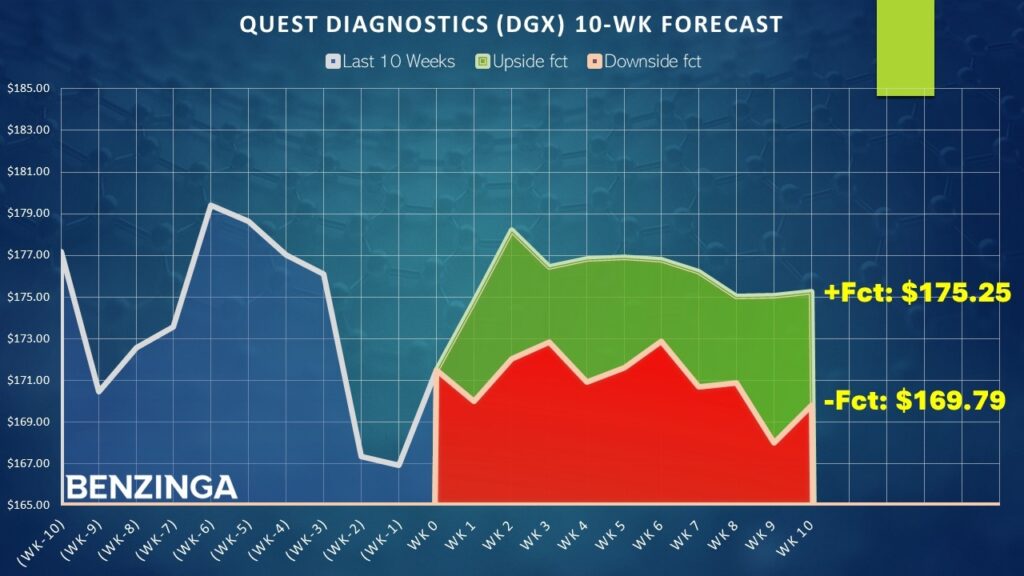
Assuming that DGX stock closes this week at around $171.50, it could be on pace to hit $178.22. Given the psychological pull, it's not unreasonable — based on both empirical data and heuristics — for DGX to hit $180.
Identifying A Realistically Aggressive Trade
Using the intelligence above, there may be a case to consider the 175/180 bull call spread expiring Aug. 15. This transaction requires buying the $175 call and simultaneously selling the $180 call, for a net debit paid of $185 (the most that can be lost in the trade). Should DGX stock rise through the short strike price ($180) at expiration, the maximum reward is $315, a payout of over 170%.
The breakeven price for the above trade is $176.85. For full disclosure, DGX will require a better-than-median performance if the implications of the 4-6-D sequence hold true.
But just how reliable is the sequence? Running a one-tailed binomial test reveals a p-value of 0.0366, translating colloquially to a 96.34% confidence level that the signal is "intentional" rather than random. This meets the scientific standard for statistical significance.
No, this doesn't mean that a successful trading outcome is guaranteed. You must always remember that the stock market is an open and highly entropic system. However, if you are going to get anything out of this article, it's that you never have to settle for unsubstantiated opinions — even in open systems, you can use science to better inform your decision-making process.
The opinions and views expressed in this content are those of the individual author and do not necessarily reflect the views of Benzinga. Benzinga is not responsible for the accuracy or reliability of any information provided herein. This content is for informational purposes only and should not be misconstrued as investment advice or a recommendation to buy or sell any security. Readers are asked not to rely on the opinions or information herein, and encouraged to do their own due diligence before making investing decisions.
Read More:
Photo: Shutterstock