While the ceasefire between Israel and Iran represented a positive development following a tense geopolitical flashpoint, it wasn't without consequence. The agreement between the two warring nations to halt hostilities led to a conspicuous decline in gold, which took down other precious metals, including silver. Subsequently, the miner sector also incurred a correction, with Pan American Silver Corp (NYSE:PAAS) losing about 5% on Friday. Still, silver's core demand profile could make PAAS stock intriguing.
From a monetary perspective, several experts have pointed to the gold-silver ratio, which is a historical measure of how many ounces of silver one ounce of gold can buy. As the theory goes, if the ratio reverts to its long-term average, the silver market could soar. According to Incrementum AG fund manager Ronald-Peter Stöferle, gold at $3,000 would imply a silver price that could reach between $55 and $63 per ounce.
An even more important argument centers on the fundamentals. Silver represents a key commodity for several emerging industries, including solar panels and electric vehicles. Notably, despite the ongoing economic challenges of the post-pandemic era, EV sales continue to rise, potentially boding well for PAAS stock and the underlying silver industry.
To drive home the case for the precious metal, 2025 will mark the fifth consecutive year of silver supply deficits. Since 2021, silver's cumulative shortfall stands at nearly 800 million ounces — about the size of an entire year's mining production. Further, advanced battery technologies could require greater silver consumption, exacerbating the supply crunch.
Statistical Case Shines A Bright Light On PAAS Stock
Although the narrative for PAAS stock is arguably compelling, storylines don't provide much specificity. For those operating within a short-term window (particularly options traders), a thesis regarding the magnitude (y-axis) of an asset isn't enough; the forecast must also include consideration of the time element (x-axis) because options eventually expire.
It's no surprise, then, that options traders live in a world of probabilities. However, the use of statistics in the financial realm is a tricky matter. It's not as straightforward as taking the frequency of the desired outcome and dividing it by the total number of events in the dataset. Such an approach calculates the derivative probability, which is the outcome odds across the dataset's entire distribution.
What options traders are looking for? That would be the conditional probability or the outcome odds across a specific subset of the data. This is the key difference between quantitative analysis and quantified analysis.
For example, a backtest of MACD crossovers may reveal a 60% success rate. However, this ratio is a derivative probability because it covers all instances of the MACD crossover across the length of the dataset. Unfortunately, this ratio doesn't reveal the odds of success when the crossover flashes at the moment of the transaction.
To apply conditional probabilities requires that the dataset speak a unified language, which is where market breadth comes into play. By converting the continuous signal of share prices into a binary code of accumulative and distributive sessions, demand profiles can be segregated into distinct, discrete behavioral states. With this framework, it's easier to extract probabilistic forecasts based on the study of past analogs.
In the past two months, the price action of PAAS stock can be converted as a "4-6-D" sequence: four up weeks, six down weeks, with a negative trajectory across the 10-week period. While this process compresses PAAS' magnitude dynamism, it categorizes the stock's demand profile as distinct behavioral states across 10-week intervals. This way, it's easier to determine forward transitions.
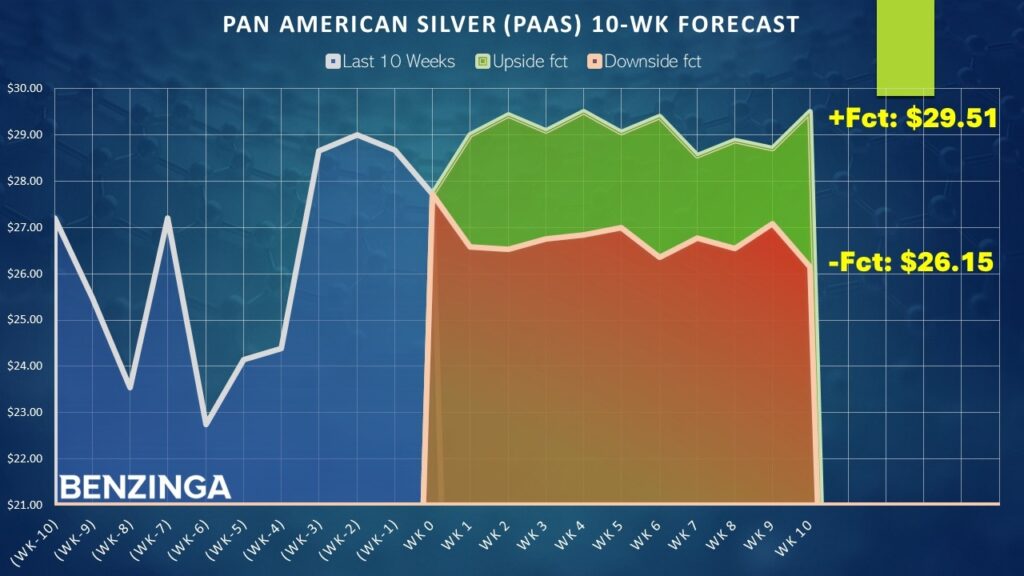
Using this framework, a trader can objectively determine that since January 2019, the 4-6-D sequence flashed 56 times. Notably, in 64.29% of cases, the following week's price action results in upside, with a median return of 4.62%. Should the bulls maintain control of the market for a second week, speculators may expect an additional 1.48% of performance to be tacked on.
On Friday, PAAS stock closed at $27.72. If the implications of the 4-6-D pan out, the security could reach $29.43 over the next two to three weeks.
A Tempting Offer On The Table
With the above market intelligence, aggressive speculators may consider the 28/29 bull call spread expiring July 18. This transaction involves buying the $28 call and simultaneously selling the $29 call, for a net debit paid of $50 (the most that can be lost in the trade). Should PAAS stock rise through the short strike price ($29) at expiration, the maximum reward is also $50, a payout of 100%.
Primarily, this trade is enticing because of the implied shift in sentiment regime of the 4-6-D sequence. As a baseline (from the same January 2019 starting point), the chance that a long position in PAAS stock will be profitable on any given week is only 52.8%. Thus, the aforementioned sequence adds 11.49 percentage points of favorable odds to the bullish speculator.
To be clear, this is an exercise in probabilities, not certainties. Further, the stock market is an open system, which means that borrowing concepts from models covering closed-system behaviors will inherently carry some statistical vulnerabilities. Still, discretizing continuous signals to extract conditional probabilities yields tangible guideposts to help navigate prospective options-based opportunities.
The opinions and views expressed in this content are those of the individual author and do not necessarily reflect the views of Benzinga. Benzinga is not responsible for the accuracy or reliability of any information provided herein. This content is for informational purposes only and should not be misconstrued as investment advice or a recommendation to buy or sell any security. Readers are asked not to rely on the opinions or information herein, and encouraged to do their own due diligence before making investing decisions.
Read Next:
Photo: Shutterstock