It's been a rough week for Nokia (NYSE:NOK) investors following a very disappointing set of results for the company's second-quarter earnings report. After a strong start to 2025, circumstances started to unravel earlier this month. With the poor financial performance baked into the security, NOK stock finds itself down about 3% for the year. Still, for the bargain-hunting types, Nokia could be an intriguing contrarian prospect.
To be sure, there's no sugarcoating the bad news. On Tuesday prior to the earnings release, Nokia announced that it would cut its full-year 2025 operating profit outlook due to currency headwinds and tariff impacts. Specifically, management lowered its comparable operating profit guidance range to between 1.6 billion euros and 2.1 billion euros, down from the previous range of 1.9 billion euros to 2.4 billion euros.
Unfortunately, even prepping for the pessimism couldn't mitigate the shock when the actual second-quarter print was released. Nokia posted earnings per share of 4 cents, a negative surprise of 37.14%. It was also well off from the year-ago quarter's earnings of 7 cents per share. On the top line, the telecommunications giant generated sales of $5.15 billion, down 3.84% against analysts' expectations. Last year, the company rang up sales of $4.81 billion.
Still, it's possible that NOK stock could be suffering an overreaction. No, the company is not the sterling benchmark of the telecom sector. However, management has invested heavily into digital infrastructure, referring to the underlying systems that power the modern internet and communications landscape.
Earlier this year, Nokia expanded its Industry 4.0 applications, which help machines and sensors connect through secure, low-latency, high-bandwidth networks. According to Grand View Research, the global Industry 4.0 market size could expand to $627.59 billion by 2030, representing a compound annual growth rate of 19.9%.
Making An Empirical Case For Speculation
A common aphorism in the market is to buy low and sell high. That would seem to apply to NOK stock, at least from a superficial level. In the past five sessions, NOK is down more than 9%. In the trailing month, it's looking at a loss of 16.5%. Of course, there has to be a way to distinguish between a truly flawed enterprise versus one with legitimate upside potential.
Here, the typical assessment is to rely on fundamental or technical analysis to gauge the proper value of the security at hand. But the problem with these methodologies is that value is an unbounded, undefinable signal. If you survey investors and ask them what price NOK stock should be at, you'd get a wide range of answers.
However, if you ask if NOK is worth their time (as in money), that's a yes-or-no question. And the answer is the empirical truth of Nokia stock.
In the last 10 weeks, the only objective truth that we know is that the market voted to be a net buyer four times and a net seller six times. Throughout this period, NOK stock suffered a downward trajectory. For simplicity, we can abbreviate the sequence as 4-6-D.
Initially, it might sound strange to compress a security's profit-and-loss dynamics into a simple binary code. But this is the beauty of the approach — we're collecting the market's voting record. Frankly, I don't care how much the market likes or dislikes Nokia. I don't care how many rallies it attended. I only look at the bottom line: net buyer or net seller?
Conducting the above exercise across rolling 10-week intervals (going back to January 2019) gives us the following demand profile:
| L10 Category | Sample Size | Up Probability | Baseline Probability | Median Return if Up |
| 2-8-D | 8 | 87.50% | 52.05% | 3.23% |
| 3-7-D | 19 | 52.63% | 52.05% | 1.39% |
| 4-6-D | 27 | 62.96% | 52.05% | 2.85% |
| 4-6-U | 13 | 38.46% | 52.05% | 1.38% |
| 5-5-D | 39 | 58.97% | 52.05% | 2.42% |
| 5-5-U | 28 | 53.57% | 52.05% | 1.92% |
| 6-4-D | 17 | 64.71% | 52.05% | 2.98% |
| 6-4-U | 47 | 42.55% | 52.05% | 2.15% |
| 7-3-D | 2 | 50.00% | 52.05% | 0.26% |
| 7-3-U | 54 | 57.41% | 52.05% | 2.11% |
| 8-2-U | 11 | 18.18% | 52.05% | 4.92% |
If you're a fan of applied game theory, you can see my logic. Essentially, if we assume no mispricing, the null hypothesis would be equivalent to the baseline probability of a long position in NOK stock rising on any given week. So, Nokia's batting average, if you will, is 52.05%.
My alternative hypothesis is that the 4-6-D sequence is signaling a favorable mispricing; specifically, that the one-week upside probability is now 62.96%, with a median expected return of 2.85%. At time of writing, NOK stock is exchanging hands at $4.32. With this assumption, the security could be on course to hit $4.44 rather quickly.
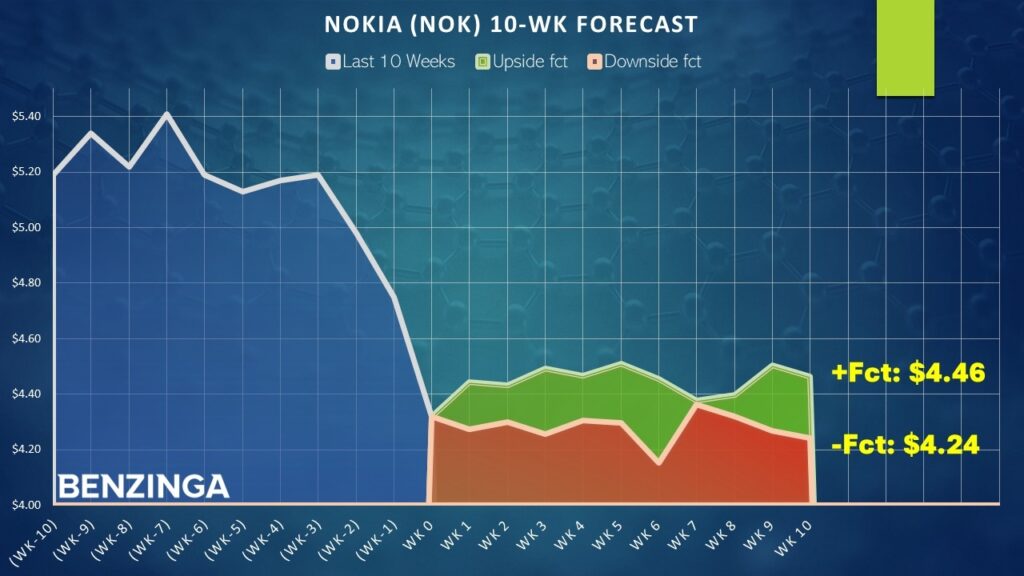
Mathematically, forecasting out to future weeks is extremely difficult due to the propagation of uncertainty. There's always an incurred error in any forecast. The further you forecast out, the more errors are compounded. With that said, if the bulls maintain control of the market for the next three weeks, NOK stock has a legitimate shot to reach $4.50.
Multiple Trades To Consider
From the assessment above, perhaps the most rational idea is the 4.00/4.50 bull call spread expiring Aug. 29. This transaction involves buying the $4 call and simultaneously selling the $4.50 call, for a net debit paid of $30 (the most that can be lost in the trade). Should NOK stock rise through the short strike price ($4.50) at expiration, the maximum reward is $20, a payout of nearly 67%.
Honestly, it's not the greatest payout. However, with a cheap net debit, it could be attractive for certain speculators. One could just buy the $4.00 call outright for 36 cents or $36 when applying the options multiplier. However, if NOK does peak at $4.50 at expiration, the reward would be $14. However, just buying the call would be the right move if you anticipate a move beyond $4.56.
One last point to consider is the statistical viability of the 4-6-D sequence. Running a one-tailed binomial test reveals a p-value of 0.2288, which essentially means that there's a 22.88% chance that the forecasted response to the 4-6-D could occur randomly. Admittedly, that's not great. However, I would argue that in the context of the stock market's open, entropic system, this is an interesting signal, especially with the relatively cheap debit.
The opinions and views expressed in this content are those of the individual author and do not necessarily reflect the views of Benzinga. Benzinga is not responsible for the accuracy or reliability of any information provided herein. This content is for informational purposes only and should not be misconstrued as investment advice or a recommendation to buy or sell any security. Readers are asked not to rely on the opinions or information herein, and encouraged to do their own due diligence before making investing decisions.
Read More:
Photo: Shutterstock