Flutter Entertainment Inc. (NYSE:FLUT) initially saw its market value climb following the disclosure of its latest financial performance. Unfortunately, as analysts and investors fully digested the news — which involved mixed results and a softened outlook — FLUT stock crumbled. In the trailing week, it's down 12% while in the past 30 days, it slipped about 20%. Still, traders historically view extreme pessimism as a buying opportunity, which presents FLUT as a high-risk, high-reward prospect.
To be sure, observers have reason to be skeptical. True, the FanDuel parent posted earnings of $1.64 per share in the third quarter, beating out Wall Street analysts' consensus target of 86 cents. However, the sports betting and gambling company also generated revenue of only $3.79 billion, which missed expectations calling for $3.9 billion.
What probably did the most damage was the fiscal 2025 revenue outlook, which saw Flutter lower the forecasted print to $16.69 billion relative to the $17.05 billion estimate. Amid sustained economic challenges and falling consumer sentiment, it's possible that the trimmed outlook incurred a more aggressive response than would normally be expected.
However, it's also fair to point out that there were notable positives. Specifically, Sportsbook AMP growth accelerated to 5% (up from 4% below parity in the second quarter). Also, Flutter increased its FanDuel investment, which has yielded encouraging growth metrics.
Finally, on a fundamental note, key valuation ratios regarding earnings and sales have slipped below levels seen in the past year. To stay consistent with earlier commentary, such ratios aren't universal truth claims. Still, the reduction shows that FLUT stock is trading at a relative discount.
More enticingly, from a quantitative perspective, traders have demonstrated a tendency to buy the dips. Potentially, this dynamic could provide data-driven traders with an asymmetric edge.
Why the Odds Just Might Favor a Bullish Position in FLUT Stock
It goes without saying that no one knows exactly what the future holds, especially in the equities market. Unlike many natural environments, the stock market is an open system, meaning that exogenous factors could easily enter and disrupt proceedings. These factors — which are later exacerbated by human collective psychology — are simply unpredictable.
That said, the market is a probabilistic environment. Similar to baseball, it's impossible to tell precisely where a ball is going to be put into play prior to the swing. However, over a hundred at-bats, certain tendencies or spray patterns are observable, which undergird the sport's sabermetrics. Further, certain players may demonstrate different tendencies depending on game conditions, such as runners in scoring position.
As it turns out, the same principles can be applied to the equities sector. Using a Kolmogorov-Markov framework layered with kernel density estimation, price behaviors can be treated as a discretized, measurable probability space with real outcomes and distributions.
In the case of FLUT stock, the above approach can be used to forecast its 10-week median returns as a probabilistic curve, with outcomes ranging between $194 and $223 (assuming an anchor price of $201). Further, price clustering would likely be predominant at $210.
The above assessment aggregates all sequences since January 2019. However, FLUT stock is not in a homeostatic or baseline state but rather in a highly distributive 2-8-D formation; that is, in the trailing 10 weeks, FLUT has printed only two up weeks and eight down weeks, with an overall downward slope.
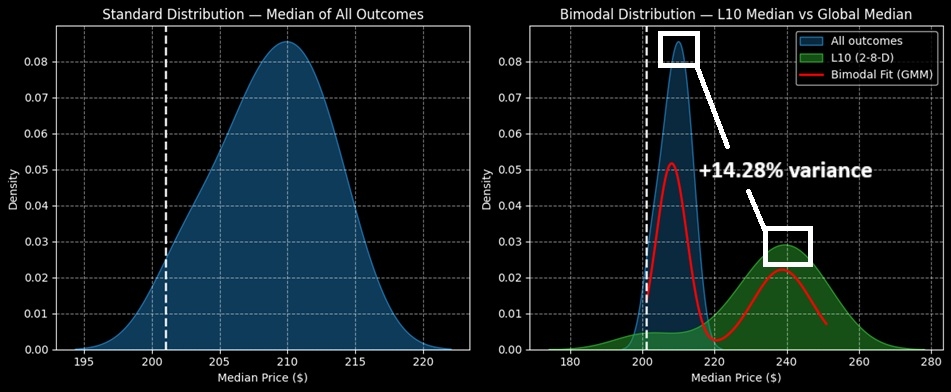
Under this condition, the forward 10-week median returns would be expected to expand, with the fat-tail risk dropping to around $170. However, the fat-tail reward swings to just short of $280. Most enticingly, price clustering would likely be predominant at $240.
Essentially, this could be an informational arbitrage. While the broader market may be anticipating only a modest dead-cat bounce, historical tendencies suggest the move could be sharper.
Now, the caveat is that the 2-8-D sequence is extremely rare, having only occurred a handful of times since FLUT's public market debut. However, out-of-sample tests on the slightly less distributive (but more numerically frequent) 3-7-D sequence also demonstrate buy-the-dip tendencies.
A Tempting Proposition on the Table
With the market intelligence above, the trade that arguably makes the most sense might be the 220/230 bull call spread expiring Jan. 16, 2026. This trade involves buying the $220 call and simultaneously selling the $230 call, for a net debit paid of $360 (the most that can be lost).
Should FLUT stock rise through the second-leg strike ($230) at expiration, the maximum profit would come out to $640, a payout of almost 178%. Further, the breakeven price lands at $223.60.
Of course, there are much more tempting ideas for the Jan. 16 options chain, such as the 230/240 spread. Triggering the second-leg strike here would lead to a payout of 300%. However, because of the rarity of the 2-8-D signal, it may not be prudent to be ultra-aggressive.
Read Next:
Photo: Piotr Swat / Shutterstock.com