At first glance, Novo Nordisk (NYSE:NVO) doesn't appear at all enticing. Down roughly 11% in the trailing month, NVO stock has been a victim of broader market pressure. But it's also the red ink that makes the pharmaceutical giant an enticing opportunity for options traders.
Every day, my routine involves scanning hundreds of stocks to find the most compelling opportunities to discuss. Prior to my exploration of quantitative analysis, this process involved scouring the news cycle for interesting ideas. I would then pull up price charts manually and attempt to uncover potential patterns.
Of course, the problem with this approach was two-fold. First, there are about 6,000 publicly traded securities available today. It's highly unlikely that I — or anyone else for the matter — am so special that I can just magically stumble upon compelling opportunities. Second, and more critically, any patterns that I did find required presumed consensus that other people are also seeing the same significant formation.
Another problem that I encountered was that I had zero idea what the denominator of the supposed pattern that I identified really was. For example, we may agree that a chart pattern is a bullish pennant formation. Subsequently, the assumption is that at the apex of the pennant, there's a good chance of a breakout.
The issue that consistently nagged at me was that without a denominator, the use of probabilistic language was merely a narrative-based scaffolding. To really make a statistical case for NVO stock or any other security, we have to establish a denominator; otherwise, the analysis lacks coherence.
Fortunately, that's where the quantitative approach comes into the picture — and offers a fresh approach to extracting potential opportunities.
Thinking Like A Quant To Trade NVO Stock
At the core, quantitative analysis is the study of empirical pricing behaviors to establish probabilistic outcomes, ultimately with the end goal of extracting profits. More specifically, we're trying to find signals that suggest the forward outcome is projected to be materially divergent from baseline conditions. If so, we may be able to exploit this asymmetry, especially if market makers are hedged toward a particular position.
In that regard, quantitative analysis may sound like technical analysis, except for one major distinction: falsifiability. The latter approach requires manual recognition of a signal, which then means the quality of the analysis depends solely on the quality of the analyst. In contrast, a quant signal is empirical so anyone can duplicate it.
I am not personally scanning hundreds of stocks daily. I let the computer do it — and it's found this reliable signal by NVO stock.
Basically, in the trailing 10 weeks, NVO has printed a 4-6-D sequence: four up weeks, six down weeks, with an overall downward trajectory. This sequence flashed in the back half of August, leading to a profitable bullish trade. The argument isn't that history is going to repeat because I said so. I just mention the trade because it acts as a proof of concept for the methodology.
Getting a little deeper into the granularity, the statistical concept is as follows. Under baseline conditions, the forward 10-week returns (using data going back to January 2019) would be expected to form a standard distribution, with price clustering most prominent at around $54.10 (assuming an anchor price of $53.31).
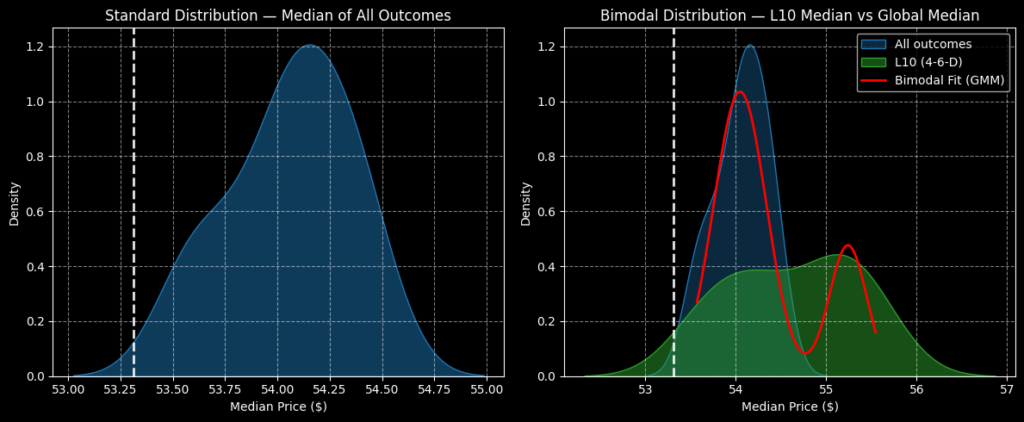
However, my argument is not that we're in baseline conditions but that the market will respond to 4-6-D conditions. Under this specific population group, NVO stock would be expected to print a relatively flattened distributional curve, with most of the reward tail extending upward in price. Still, the risk tail also extends deeper into the red than what would be expected under baseline conditions.
In other words, under 4-6-D conditions, NVO stock would be expected to see much more reward potential but with a modest increase in risk profile.
But what really catches my attention is that price clustering (again under 4-6-D conditions) would be most prominent at around $55.10. That's a 1.85% positive shift, which, while not earth-shattering, is a delta that no one else sees.
You have a structural advantage when going quant because, by definition, technical analysis is blind to this opportunity.
Playing Novo Nordisk's Numbers Game
Another advantage of going quant is that finding trading ideas is much more intuitive, so long as you lend credence to the data. With price clustering occurring most prominently at $55 and market makers offering a sizable payout for this strike price, the trade concept markets itself.
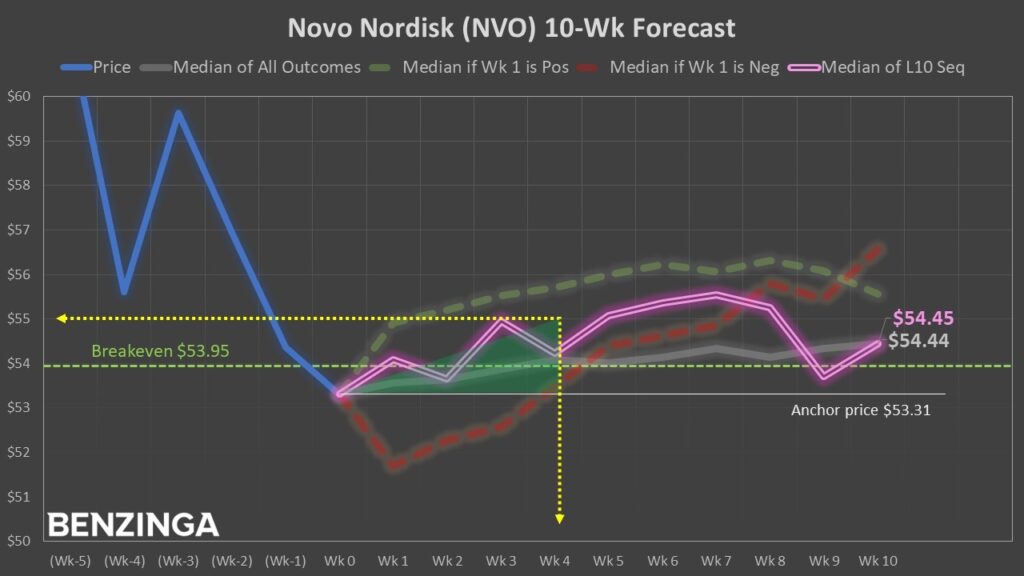
Specifically, I'm looking at the 53/55 bull call spread expiring Nov. 21. This trade will require NVO stock to rise through the second-leg strike ($55) at expiration. As I explained in detail above, this is a very realistic target. Currently, the maximum payout for triggering the strike at the required time is roughly 111%. Breakeven lands at $53.95.53.95
Now, as the August flashing of the 4-6-D sequence demonstrated, it might take the full period for the trade to materialize successfully. For those that are jittery about the expiration date may consider the 50/55 bull spread expiring Dec. 19. This trade features a max payout of 100% so the reward reduction in exchange for extra theta isn't that bad at all.
The issue, though, is that NVO stock tends to undulate — and sometimes wildly and negatively — in the later weeks. So, that risk profile will need to be considered if you decide to buy more time.
The opinions and views expressed in this content are those of the individual author and do not necessarily reflect the views of Benzinga. Benzinga is not responsible for the accuracy or reliability of any information provided herein. This content is for informational purposes only and should not be misconstrued as investment advice or a recommendation to buy or sell any security. Readers are asked not to rely on the opinions or information herein, and encouraged to do their own due diligence before making investing decisions.
Read More:
Image: Shutterstock