Snap (SNAP) stock is getting buried on Tuesday, down 42% at last check.
Bad earnings result? No. A crash in the Snapchat platform? Negative. Instead, Snap provided a worse-than-expected intra-quarter update on its business.
The company warned that revenue and adjusted Ebitda would come in below the low end of its guidance, saying, “Since we issued guidance on April 21, 2022, the macroeconomic environment has deteriorated further and faster than anticipated.”
The news sent the stock to new 52-week lows and its lowest level since April 2020. It’s now down 84% from its all-time high and has investors wondering just how low it can go.
For what it’s worth, the news is hitting everything — including the overall market.
Others in the industry are getting hit, too. Alphabet (GOOGL) (GOOG) is down over 6%, while Trade Desk (TTD) is down 20%. Pinterest (PINS) and Meta (MVRS) are down 25% and 9%, respectively.
Trading Snap Stock
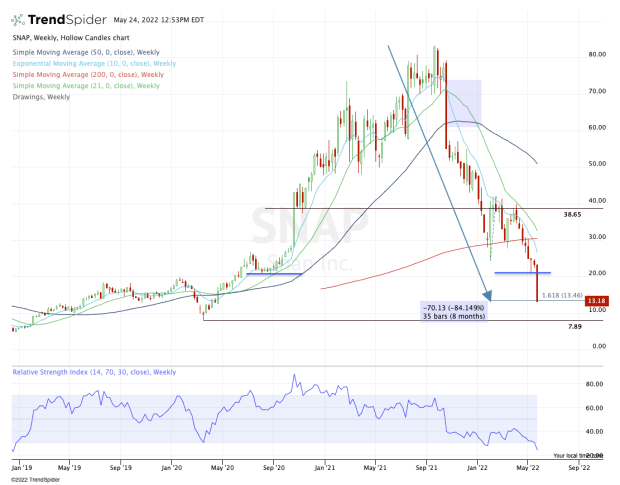
Chart courtesy of TrendSpider.com
This is one ugly chart, with Snap stock on Tuesday all but cementing its eighth straight weekly decline.
From here, investors should pay attention to certain levels.
First, it’s hard to not to look at the $10 level, purely from a psychological standpoint. I don’t know that we’ll get that low, but at this moment, there are no notable support levels nearby.
There are no retracement marks, moving averages, VWAP measures — nothing.
The lone argument you could make is the 161.8% downside extension, which comes into play at $13.46. That, however, is more of a general target than anything else. It's surely not a dependable level of support.
Instead, traders will likely need to have some patience to see if we can get some sort of consolidation after this fall.
If we get a complete breakdown, it’s not impossible that we retest the covid lows from March 2020. I don't think that would be fair, but my opinion on what’s fair doesn’t matter to the market.
On the upside, $20 will be a key area on the bounce, as will Snap stock’s short-term daily moving averages.
On a further push to the upside, keep an eye on the prior 2022 low near $24 from January. Above that and the declining 10-week moving average could put the $28 to $30 area and the 200-week moving average in play.