Nvidia Corporation (NASDAQ:NVDA) reached a new 52-week low on Friday, despite the S&P 500 trading slightly higher.
Chip stocks, like much of the technology sector, have declined heavily this year, with Nvidia plunging 50% from its 2022 opening price of $297.85. Comparably, Advanced Micro Devices, Inc (NASDAQ:AMD) has plummeted 49% and Micron Technology, Inc (NASDAQ:MU) has slid 45% over the same time period.
Chip stocks enjoyed a massive bull run after the COVID-19 crash in March 2020 amid a shortage in the technology that rippled through the tech sector. Soaring inflation and fears of a looming recession have now hampered demand.
When Micron printed its third-quarter financial results on Thursday, a downturn in the sector was all but confirmed.
Although Micron printed an earnings beat, reporting quarterly adjusted earnings of $2.59 per share, compared to the estimate of $2.44 per share, the company’s guidance for the fourth quarter came in significantly short of expectations.
For the fourth quarter, Micron guided EPS of between $1.43 and $1.83 versus the estimate of $2.62 per share on revenues of $6.8 billion to $7.6 billion versus the $9.05 billion estimate.
Micron was falling more than 5% lower on Friday in reaction to the news and Nvidia and AMD were falling in sympathy, trading down about 4% each. Investors likely expect the companion chip stocks to report weakened forward-looking guidance when Nvidia and AMD report earnings on Aug. 17 and July 26, respectively.
On Thursday, Ritholtz Wealth Management's Josh Brown pointed out on CNBC's "Fast Money Halftime Report" that Nvidia has been in a solid and well-defined downtrend. That downtrend looks set to continue because on Friday Nvidia fell bearishly through the bottom support line of a falling channel pattern.
Want direct analysis? Find me in the BZ Pro lounge! Click here for a free trial.
The Nvidia Chart: Nvidia’s most recent downtrend was taking place within a falling channel pattern, which the stock began trading in on May 4, after a brief rally to the upside. A falling channel is considered to be bearish unless a stock breaks up from the upper descending trendline of the pattern, but when a stock drop through the bottom of the channel, it can incite fear selling.
- Eventually, another bounce to the upside is likely to come, likely only to cause the stock to print another lower high because exaggerated bullish divergence has developed on Nvidia’s chart. An exaggerated bullish divergence occurs when a stock makes a series of lower lows but the relative strength index’s lows remain flat.
- If Nvidia closes the trading day near its low-of-day price, the stock will print a bearish kicker candlestick, which could indicate lower prices will come again on Monday. If that happens, bullish traders can watch for the stock to print a reversal candlestick, such as a doji or hammer candlestick, over the following few days to signal an impending bounce.
- For bearish traders, the “trend is your friend” for the foreseeable future. Traders who are already in a short position will feel comfortable holding until Nvidia is able to signal a trend change by printing a higher high or higher low. For traders who aren’t already in a position, the next higher low could provide a solid entry.
- Nvidia has resistance above at $145.75 and $161.37 and support below at $135.43 and $126.37.
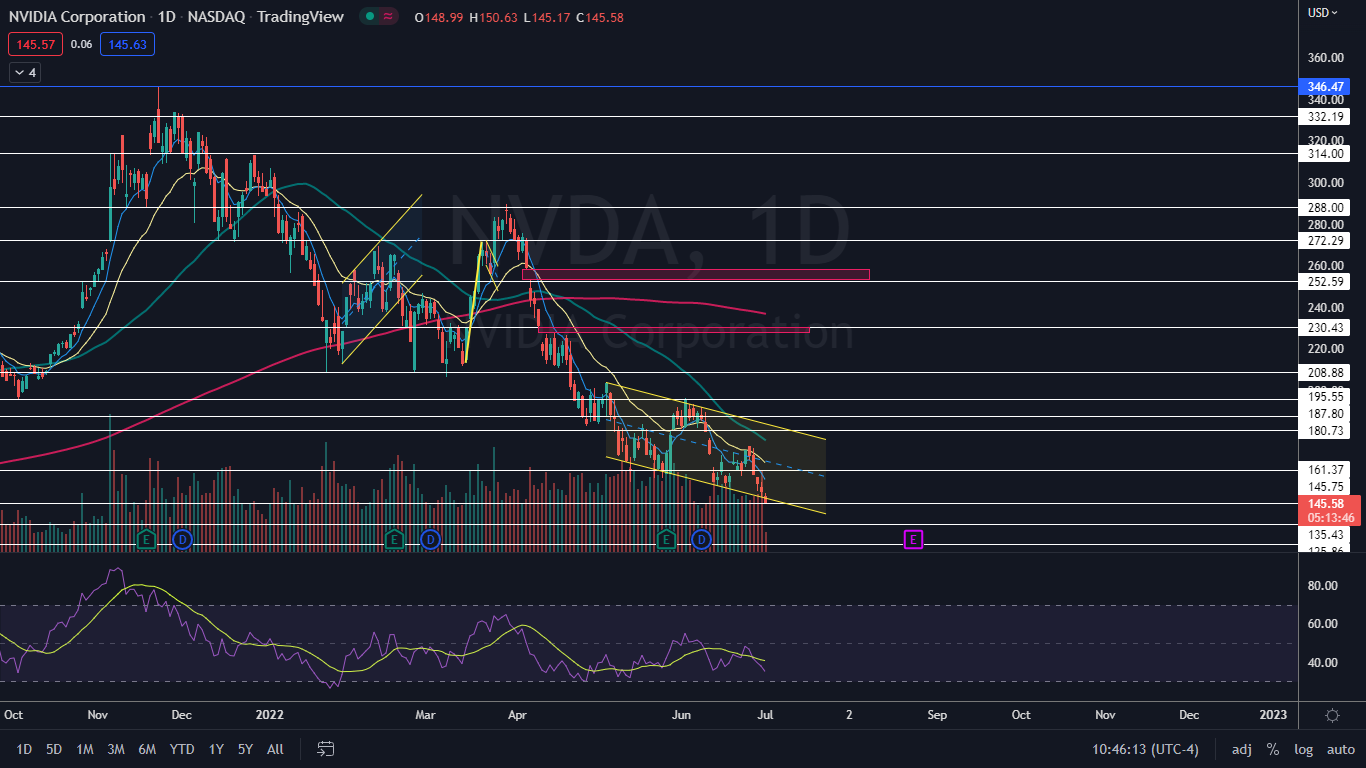
Photo: H_Ko via Shutterstock