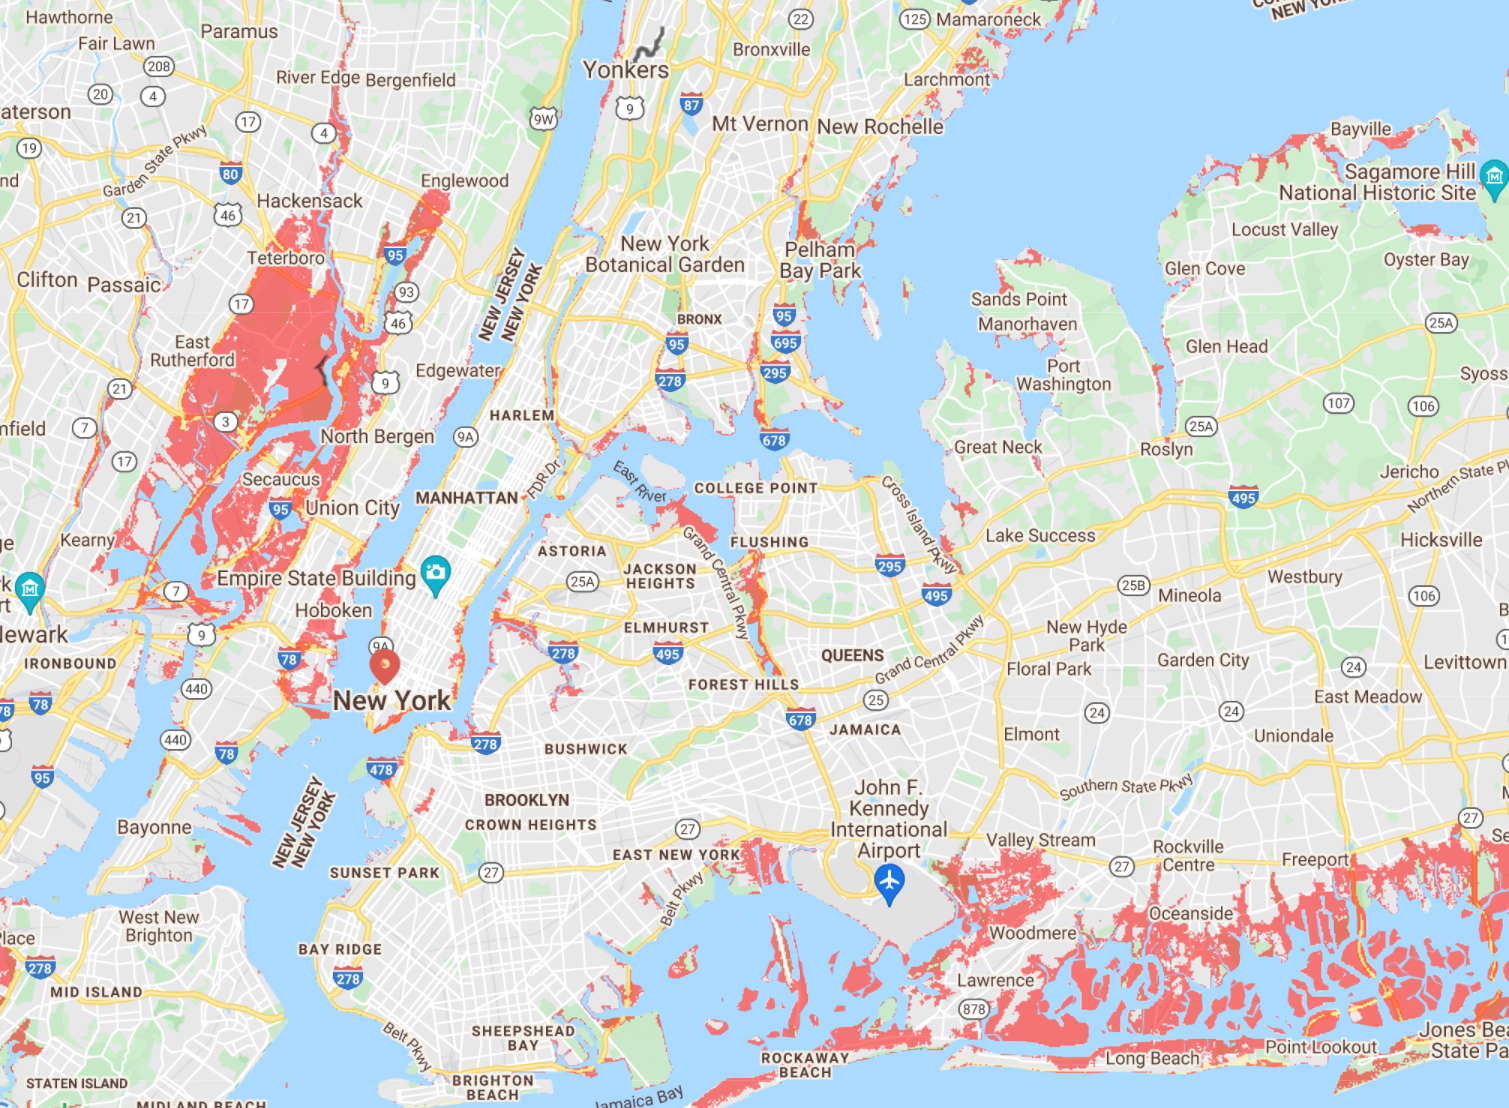
A map shows the areas of New York City that face regular flooding by 2030 as extreme weather becomes more common because of the climate crisis.
The startling image, created using a new NASA tool to visualise sea level rise in the coming decades, shows vast swathes of the city of 8.4 million, as well as neighbouring New Jersey, vulnerable to rising sea levels.
Last month Tropical Storm Elsa caused widespread flooding in New York and the surrounding area.
Videos posted to social media showed the impact of the downpours on apartment buildings, roadways, and the New York subway system. At the 157th Street station in Washington Heights in upper Manhattan, one woman could be seen plunging into the dark water to make her way to the train.
Experts pointed out that the century-old transit network was not designed for the impacts of an ever-worsening climate crisis. Even on dry days, the Metropolitan Transportation Authority is pumping out millions of gallons of water from the subway system.
NASA’s sea level projection tool was launched after the release of the Intergovernmental Panel on Climate Change’s (IPCC) first chapter from its sixth assessment report.
The tool, hosted on NASA’s Sea Level Portal, shows in detail how different parts of the world will be impacted by sea level rise under a range of emissions trajectories.
By selecting options from a drop-down menu, users can zoom into locations across the ocean and on every coastline between 2020 and 2150 to see what will happen depending on how rapidly the curve does – or doesn’t – bend on cutting emissions.
The tool also provides a look at different processes behind sea level rise like the melting of ice sheets and glaciers, and the extent to which ocean waters shift their circulation patterns or expand as they warm.
Sea levels have risen increasingly rapidly since about 1970 and in the past 100 years has risen more than in any century over at least the past three millennia. The global average sea level has risen at a rate of about four millimeters (0.16inches) per year over the last decade.
With nearly half of the global population living within 60 miles of the coast, the rise in sea levels is already impacting people in many parts of the world.