New Orleans has seen its population drop by nearly 30% over the last 10 years according to data released last week by the US Census.
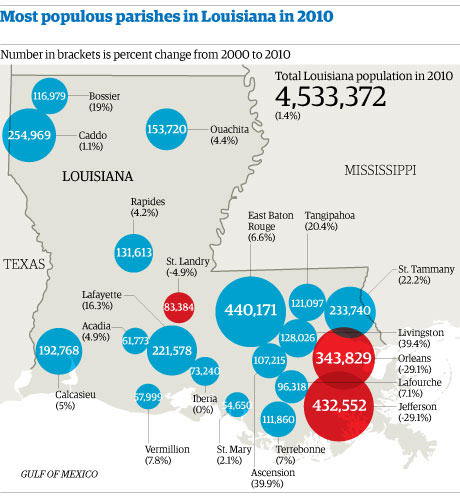
Despite a -29.1% drop in population in the city, partly put down to the destruction of Hurricane Katrina in 2005, the state of Louisiana as a whole has had an increase in population. The state has grown by over 64,000 during the last ten years according to the latest census figures.
New Orleans city recorded a population of 343,829 in 2010 – a decrease of 140,845 from the last census in 2000. Opelousas in the St.Landry Parish is another city that has seen a dramatic decrease with a -27.2% drop over the last decade.
The graphic below by Finbarr Sheehy shows clearly that despite a few large decreases - those in red - many parishes have seen a growth in numbers leading to a 1.4% increase for Louisiana.
The census data also recorded a 1.8% increase in Louisana of those identifying themselves as Hispanic and Latino.
Amongst those seeing a rise of over 20% in population were Ascension Parish, Livingston Parish, Tangipahoa Parish and St. Tammany Parish.
Whilst we await the results of the UK census due to take place this year, the US census has given a breakdown by the states in this great interactive showing population density and the change since 1910. We wanted to take a look at some of the great data the US census is publishing - and see whether you can do anything wonderful with it.
We have the Louisiana data by most populous parish and incorporated places and also the racial breakdown of the population in our spreadsheet. Can you do anything with this data?
Data summary
| Population rank 2010 | Population rank 2000 | Geographic area | Population (2000) | Population (2010) | Number change, 2000- 2010 | Population change 2000-2010 (%) |
|---|---|---|---|---|---|---|
| Louisiana | 4 468 976 | 4 533 372 | 64 396 | 1.4 | ||
| 1 | 1 | New Orleans city | 484 674 | 343 829 | - 140 845 | -29.1 |
| 2 | 2 | Baton Rouge city | 227 818 | 229 493 | 1 675 | 0.7 |
| 3 | 3 | Shreveport city | 200 145 | 199 311 | -834 | -0.4 |
| 4 | 4 | Lafayette city | 110 257 | 120 623 | 10 366 | 9.4 |
| 5 | 5 | Lake Charles city | 71 757 | 71 993 | 236 | 0.3 |
| 6 | 6 | Kenner city | 70 517 | 66 702 | - 3 815 | -5.4 |
| 7 | 7 | Bossier City city | 56 461 | 61 315 | 4 854 | 8.6 |
| 8 | 8 | Monroe city | 53 107 | 48 815 | - 4 292 | -8.1 |
| 9 | 9 | Alexandria city | 46 342 | 47 723 | 1 381 | 3 |
| 10 | 11 | Houma city | 32 393 | 33 727 | 1 334 | 4.1 |
| 11 | 10 | New Iberia city | 32 623 | 30 617 | - 2 006 | -6.1 |
| 12 | 12 | Slidell city | 25 695 | 27 068 | 1 373 | 5.3 |
| 13 | N/A | Central city | N/A | 26 864 | N/A | N/A |
| 14 | 14 | Ruston city | 20 546 | 21 859 | 1 313 | 6.4 |
| 15 | 15 | Sulphur city | 20 512 | 20 410 | -102 | -0.5 |
| 16 | 17 | Hammond city | 17 639 | 20 019 | 2 380 | 13.5 |
| 17 | 16 | Natchitoches city | 17 865 | 18 323 | 458 | 2.6 |
| 18 | 18 | Gretna city | 17 423 | 17 736 | 313 | 1.8 |
| 19 | 13 | Opelousas city | 22 860 | 16 634 | - 6 226 | -27.2 |
| 20 | 30 | Zachary city | 11 275 | 14 960 | 3 685 | 32.7 |
|
SOURCE: US CENSUS 2010 |
||||||
| Population rank 2010 | Population rank 2000 | Geographic area | Population (2000) | Population (2010) | Number change, 2000- 2010 | Population change 2000-2010 (%) |
|---|---|---|---|---|---|---|
| - | - | Louisiana | 4 468 976 | 4 533 372 | 64 396 | 1.4 |
| 1 | 3 | East Baton Rouge Parish | 412 852 | 440 171 | 27 319 | 6.6 |
| 2 | 2 | Jefferson Parish | 455 466 | 432 552 | - 22 914 | -5 |
| 3 | 1 | Orleans Parish | 484 674 | 343 829 | - 140 845 | -29.1 |
| 4 | 4 | Caddo Parish | 252 161 | 254 969 | 2 808 | 1.1 |
| 5 | 5 | St. Tammany Parish | 191 268 | 233 740 | 42 472 | 22.2 |
| 6 | 6 | Lafayette Parish | 190 503 | 221 578 | 31 075 | 16.3 |
| 7 | 7 | Calcasieu Parish | 183 577 | 192 768 | 9 191 | 5 |
| 8 | 8 | Ouachita Parish | 147 250 | 153 720 | 6 470 | 4.4 |
| 9 | 9 | Rapides Parish | 126 337 | 131 613 | 5 276 | 4.2 |
| 10 | 13 | Livingston Parish | 91 814 | 128 026 | 36 212 | 39.4 |
| 11 | 11 | Tangipahoa Parish | 100 588 | 121 097 | 20 509 | 20.4 |
| 12 | 12 | Bossier Parish | 98 310 | 116 979 | 18 669 | 19 |
| 13 | 10 | Terrebonne Parish | 104 503 | 111 860 | 7 357 | 7 |
| 14 | 16 | Ascension Parish | 76 627 | 107 215 | 30 588 | 39.9 |
| 15 | 14 | Lafourche Parish | 89 974 | 96 318 | 6 344 | 7.1 |
| 16 | 15 | St. Landry Parish | 87 700 | 83 384 | - 4 316 | -4.9 |
| 17 | 17 | Iberia Parish | 73 266 | 73 240 | -26 | - |
| 18 | 19 | Acadia Parish | 58 861 | 61 773 | 2 912 | 4.9 |
| 19 | 20 | Vermilion Parish | 53 807 | 57 999 | 4 192 | 7.8 |
| 20 | 21 | St. Mary Parish | 53 500 | 54 650 | 1 150 | 2.1 |
|
SOURCE: US CENSUS 2010 |
||||||
Download the data
• DATA: download the full spreadsheet
More data
Data journalism and data visualisations from the Guardian
World government data
• Search the world's government data with our gateway
Development and aid data
• Search the world's global development data with our gateway
Can you do something with this data?
• Flickr Please post your visualisations and mash-ups on our Flickr group
• Contact us at data@guardian.co.uk
• Get the A-Z of data
• More at the Datastore directory
• Follow us on Twitter