Tech stocks took a heavy hit in November, and chances are your portfolio felt the pain—but if panic selling is on your mind, history says you might want to hold off.
A historical deep dive into recent Nasdaq 100 pullbacks shows that sharp monthly drops like this one have often been the perfect setup for a big rebound.
Tech's Tough Month Isn't Unprecedented—And That's Good News
The Nasdaq 100 – as tracked by the Invesco QQQ Trust (NASDAQ:QQQ) – is down over 5% this month through Nov. 24, heading for its worst month since March. AI stocks cooled off, valuations came under scrutiny, and macro fears crept back in.
Yet, if history is any guide, moments like this have repeatedly delivered powerful rebounds for those bold enough to buy the dip.
Chart: Nasdaq 100 Has Logged 15 Monthly Drops Over 5% in the Past 7 Years
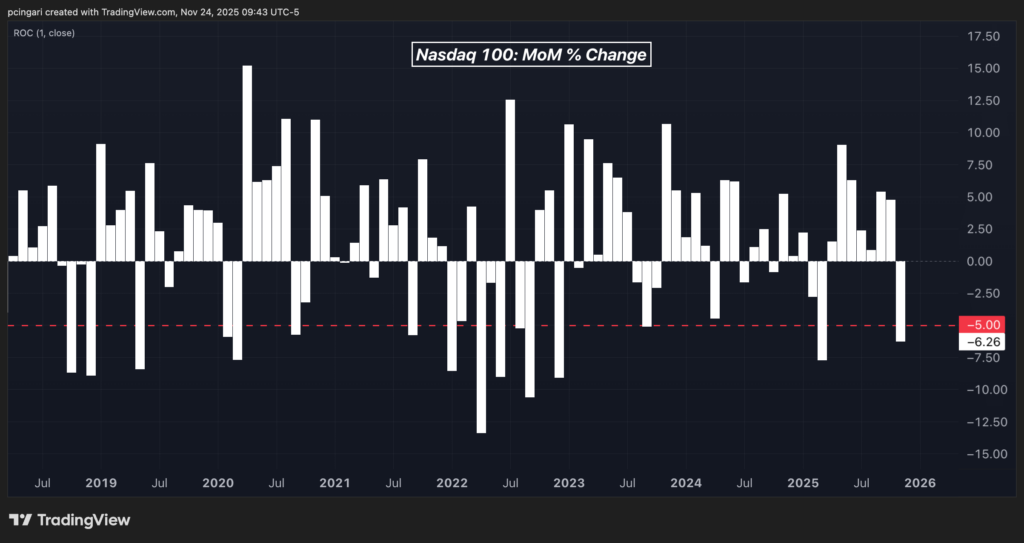
Benzinga looked at the last 15 times the Nasdaq 100 fell more than 5% in a month.
What happened next? Big gains—more often than not.
After a monthly drop of more than 5%, the Nasdaq 100 has historically gained an average of 2.56% in 1 month, 8.19% in 3 months, 15.69% in 6 months, and 27.01% over 12 months.
The probability of a positive return improved over time, with win rates of 53% at 1 month, 67% at 3 months, 73% at 6 months, and nearly 86% at 12 months.
The strongest rebound came after the COVID-driven panic in April 2020, when the Nasdaq 100 soared 67.6% over the following year. January 2023 followed closely with a 53.8% gain over 12 months, while March 2020 delivered a 52.6% return.
October 2022 added another powerful rally to the list, posting a 34.1% gain one year later.
Even more modest declines proved rewarding—after a 2% dip in October 2023, the index climbed 36.3% over the next year.
Of course, not every instance turned into a win. The worst result came after the February 2022 drop, when the Nasdaq 100 plunged 18.9% over the following year, as aggressive rate hikes pummeled growth stocks. Similarly, October 2021 ended in a 25.3% loss over 12 months.
Still, 13 of the 15 historical cases ended with positive one-year returns, reinforcing the idea that tech-sector pullbacks often set the stage for strong comebacks.
| Entry Date: After >5% NDX Monthly Drop |
Forward 1M % | Forward 3M % | Forward 6M % | Forward 12M % |
|---|---|---|---|---|
| 2018-11-01 | 0.20 | -0.86 | 1.69 | 16.03 |
| 2019-01-02 | 9.11 | 16.57 | 21.19 | 37.96 |
| 2019-06-03 | 7.62 | 7.90 | 17.90 | 34.06 |
| 2020-03-02 | -7.66 | 12.92 | 43.12 | 52.56 |
| 2020-04-01 | 15.19 | 29.99 | 46.13 | 67.55 |
| 2020-10-01 | -3.20 | 12.88 | 14.66 | 28.65 |
| 2021-10-01 | 7.90 | 11.10 | 1.01 | -25.31 |
| 2022-02-01 | -4.64 | -13.90 | -13.28 | -18.94 |
| 2022-05-02 | -1.65 | 0.72 | -11.27 | 3.04 |
| 2022-07-01 | 12.55 | -4.63 | -4.90 | 31.95 |
| 2022-09-01 | -10.60 | -1.97 | -1.87 | 26.31 |
| 2022-10-03 | 3.96 | -0.29 | 20.14 | 34.13 |
| 2023-01-03 | 10.62 | 20.49 | 38.75 | 53.81 |
| 2023-10-02 | -2.08 | 14.34 | 24.05 | 36.33 |
| 2025-04-01 | 1.52 | 17.64 | 28.02 | — |
| AVG | 2.56 | 8.19 | 15.69 | 27.01 |
| WIN % | 53.33 | 66.67 | 73.33 | 85.71 |
Time To Panic Or Time To Position?
Historical analysis offers a clear message: Nasdaq 100 pullbacks of 5% or more often precede powerful rallies.
With the index heading into the final stretch of the year on weak footing, market history suggests this may be more of a reset than a reversal.
Sure, risks remain. Not every drop leads to a rally, and macro uncertainty is far from over.
But if the market is simply pausing to catch its breath after an explosive AI-fueled year, then this pullback could set the stage for the next leg higher.
Read Next:
Image created using artificial intelligence via Midjourney.