MSCI, Inc. (MSCI), the stock index company, produced robust Q2 earnings yesterday and forecasted strong free cash flow margins. MSCI stock looks deeply undervalued here, and shorting OTM put options for income is a good play.
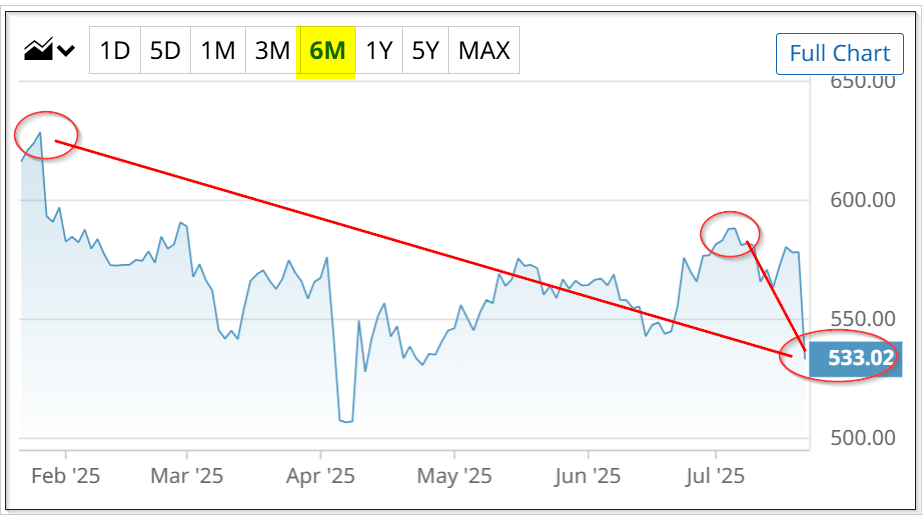
MSCI is down today at $530.75 per share, giving value investors an attractive buy-in opportunity. This is below its peak of $628.04 (Jan. 28) and a recent July 7 peak of $588.00.
MSCI could be worth at least 11% more, or $591 per share, based on an FCF yield valuation and a historical dividend yield target price. This article will show how this works out.
Strong Earnings and Free Cash Flow Guidance
MSCI reported on July 22 that its revenues jumped +9.1% in Q2 to $772.7 million and its operating income (OI) was up 11.1% YoY at $425.2 million. Moreover, its OI margin (i.e., OI/Revenue) was very high at 55%, up from 54% in Q2 last year.
Who would have thought that providing indices to the investment community would have been so profitable? I have always been amazed by this company's incredible profitability.
However, MSCI said its free cash flow (FCF) dipped slightly to $301.575 million (-6.3%), although for the six months it was down only 4.6%.
Nevertheless, this FCF still represents a very high portion of OI (70.9%) and revenue (39%). The table below from page 19 of MSCI's earnings release shows that the FCF margin will rise.
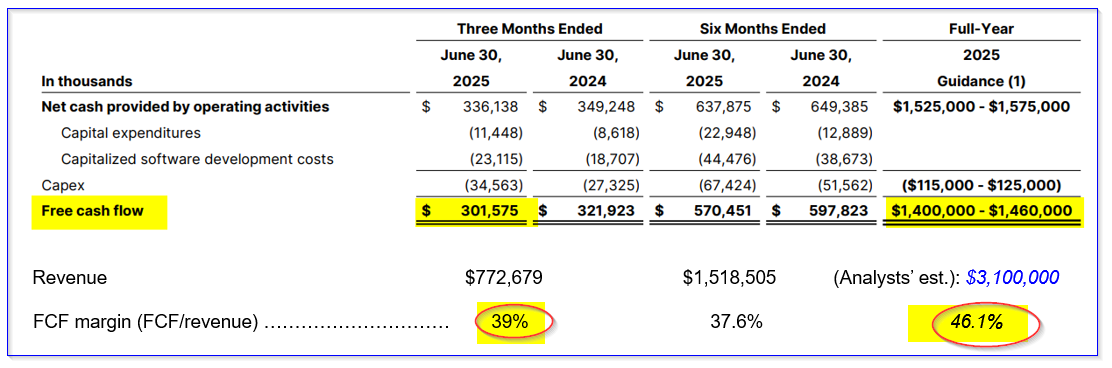
For example, note that MSCI is so confident in its operating performance that it's projecting a midpoint average of $1.43 billion in FCF for this year. That represents over 46% of analysts' estimates of $3.1 billion in revenue for 2025, according to Seeking Alpha.
Moreover, next year, analysts project revenue will rise to $3.37 billion. As a result, the next 12-month (NTM) revenue forecast is at least $3.235 billion. Here is how that affects the FCF forecast:
46.1% FCF margin x $3.235 billion = $1.491 billion FCF
That is 4.3% higher than the midpoint $1.43 billion in FCF this year. That also implies that MSCI's value could be much higher. Here's how that works out.
Projecting MSCI's Value Using FCF Yield
Over the trailing 12 months (TTM), MSCI has generated $1.446 billion in FCF, according to Stock Analysis. Since MSCI has a market value today of $41.08 billion, according to Yahoo! Finance, its TTM FCF yield is:
$1.446b / $41.08b = 0.0352 = 3.52% FCF yield
Therefore, applying this FCF yield to our FCF estimate going forward:
$1.491b / 0.0352 = $42.4 billion market value
That is +3.2% higher than today's market value, and implies MSCI could be worth 3.2% more, or $547.73 per share.
Dividend Yield Valuation
MSCI has consistently raised its dividend per share (DPS) annually for the past 10 years, according to Seeking Alpha. Moreover, its historical yield for the past 5 years has been well below 1.0%, according to both Yahoo! Finance (0.91%) and Morningstar (0.86%).
Right now, the quarterly DPS is $1.80, and if we assume it rises to $2.00 next year, the next 12-month DPS will be:
$1.80 +$1.80 +$2.00 +$2.00 = $7.60 NTM DPS
Therefore, using a 1.0% dividend yield, we can project a target price:
$7.60 / 0.01 = $760.00 per share
That is +43% over today's price. Just to be conservative, let's assume that the dividend yield over the next 12 months (NTM) averages 1.20%:
$7.60 / 0.0120 = $633.33 Target price
That is still over $100 higher than today's price, and represents a potential upside of +19.3% higher than today's price.
Summary Valuation Estimate
The bottom line is that MSCI still looks cheap using FCF yield (+3.2%) and Dividend yield (+19.3%) valuation methods. The average target price is:
FCF Yield target price ……… $547.73
Div. Yield target price ………. $633.33
Average target price …………… $590.63
Potential upside ………………… +11.2%
Nevertheless, there is no guarantee this will happen. The stock could fall from here, especially if markets falter and its index business takes a hit. One way to set a lower buy-in price is to sell short out-of-the-money (OTM) put options in nearby expiry periods.
Shorting OTM Puts
For example, look at the August 15 expiry period, 24 days to expiry (DTE). It shows that the $500 strike price put option has a midpoint premium of $4.15 per put contract.
So, the short-put yield play is:
$4.15 / $500.00 = 0.0083 = 0.83%
This is for a strike price that is 5% below today's trading price. In other words, it is 5% out-of-the-money (OTM). It means that if MSCI falls to $500.00, the investor's collateral (i.e., $500 x 100 shares per put contract, or $50,000) will be assigned to buy 100 shares of MSCI.
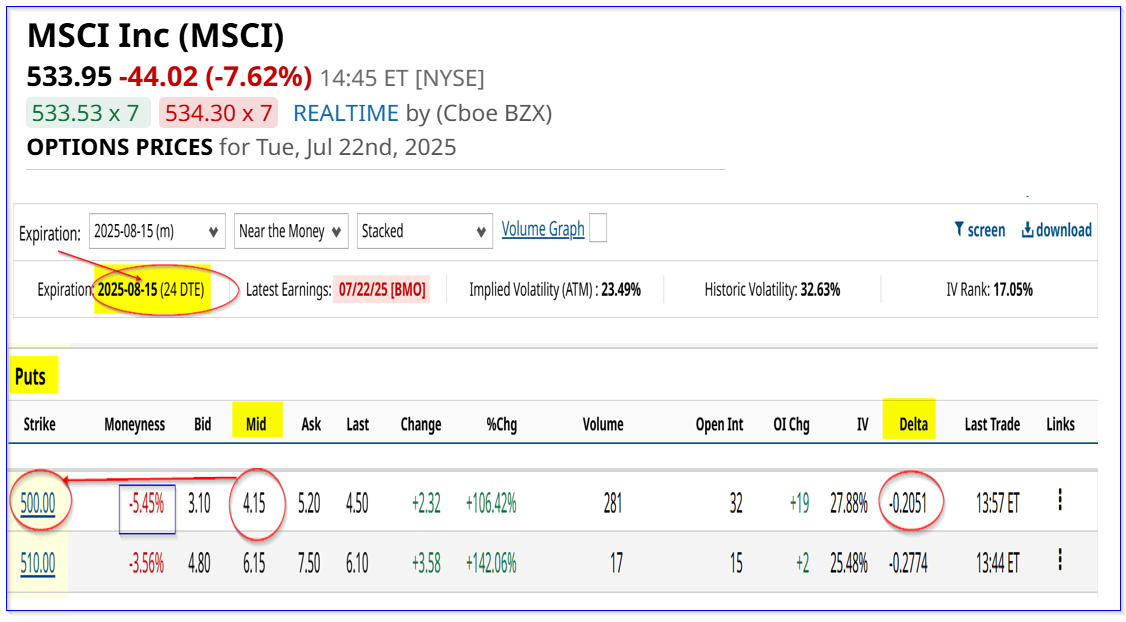
But the investor still keeps the $415 in income received when entering the order to “Sell to Open” the short-put trade. That means that the potential buy-in point has a breakeven of $500-$4.15, or $495.85.
That is 6% lower than today's price, providing a good measure of downside protection and a good buy-in price.
Note that the delta ratio is low at just 20.5%. This implies a low chance that MSCI will fall to the $500 strike price. As a result, investors willing to take on more risk can short the $510 strike price put and make a 1.206% yield (i.e., $6.15/$510.00) over the next three weeks.
Therefore, using a 50/50 mix of these two strike prices, an investor could average just over 1.0% (i.e., (0.83% +1.206%) / 2 = 1.045%) over this period.
That is a nice potential yield and represents an annualized expected return (ER) of +15.7% (i.e., 1.045% x 15 periods of 24 days in a year = 15.675%). Of course, that assumes an investor could make the same 1% yield every 24 days.
The bottom line is that MSCI stock looks undervalued here. One profitable way to play it is to sell short OTM puts in nearby expiry periods.
On the date of publication, Mark R. Hake, CFA did not have (either directly or indirectly) positions in any of the securities mentioned in this article. All information and data in this article is solely for informational purposes. For more information please view the Barchart Disclosure Policy here.