/Micron%20Technology%20Inc_%20logo%20on%20building-by%20vzphotos%20vis%20iStock.jpg)
There’s a lot going on in Idaho these days. And it's no small potatoes. The stock of Boise, Idaho-based Micro Technology (MU) is one of the most intriguing chart-based stock situations I see right now.
The maker of high-performance memory and storage technologies is in the sweet spot for growth right now. The stock has mimicked the broader tech sector’s manic 2025 so far, giving up 40% of its value in under 3 weeks in the spring, only to rally 150% since that time. That $60 stock from April is now in the $150 area.
Is MU Stock’s Big Rally Over?
Frankly, I’ve made a career out of setting up my trading so I don’t often have to answer that question. Because I own stocks in small sizes to start, and add more if a profit “buffer” builds up after I’ve bought it. Why not stand on the courage of my convictions? Because the stock market doesn’t care about me. Or any of us.
So rather than put earned money in harm’s way, when a stock surges like MU has recently, I think “it’s time to collar it!” Why not just reduce my position? Because then I reduce my upside. And I don’t want to reduce my upside if I don’t have to. Crazy, huh?
OK, so let’s chart MU and then look at how to collar it. But before I do, I want to mention one of the distinguishing features of MU in this market.
Here it is, using one of my favorite info boxes on the Barchart.com site. This is on the far left side of the page for any stock, toward the bottom of the menu, as shown here, highlighted in blue and underlined.
When I click there, I find this box to the right. What stands out to me about MU is that unlike a lot of today’s most popular stocks, it sells at 23x trailing earnings, and under 11x forward earnings estimates. That merits repeating: 11x forward P/E. That’s cheap to me.
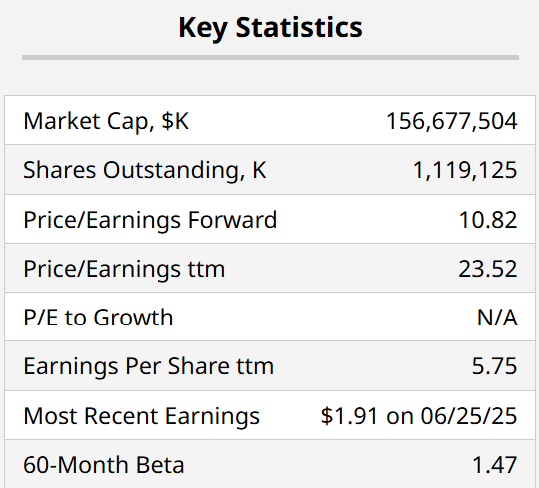
However, we always have to know what we are getting into with a single stock. That’s where I notice the nearly 1.5 beta to the S&P 500 Index ($SPX). That means MU’s stock has historically (past 5 years) moved up and down 15% on average when the broad stock market moves up and down 10%. That’s a half decade of volatility well beyond the S&P 500.
And that is why I am talking about a collar here. When a stock has told us it is volatile, I say we listen to it. And we do so by carefully managing risk when the profits have been rolling in.
I am frequently amazed by how many investors today don’t really consider this type of counterintuitive thinking. A stock goes way up, and they like it more. My ROAR Score, a technical indicator I created a while back using raw data from Barchart, is set up such that at the margin, a stock is more attractive when it falls sharply, and less attractive when it rallies strongly. That’s not the main driver of the score, but in times of extreme volatility, it does factor in.
MU’s Chart Signals Full Speed Ahead
I like to consider myself a tough grader, but MU looks pretty good here. That said, I don’t trust any stock as much as I used to, thanks to algorithmic trading and indexation dominating daily trading flows. But that’s a bigger, badder story for another day. I’m here to see how this big mover can be collared.
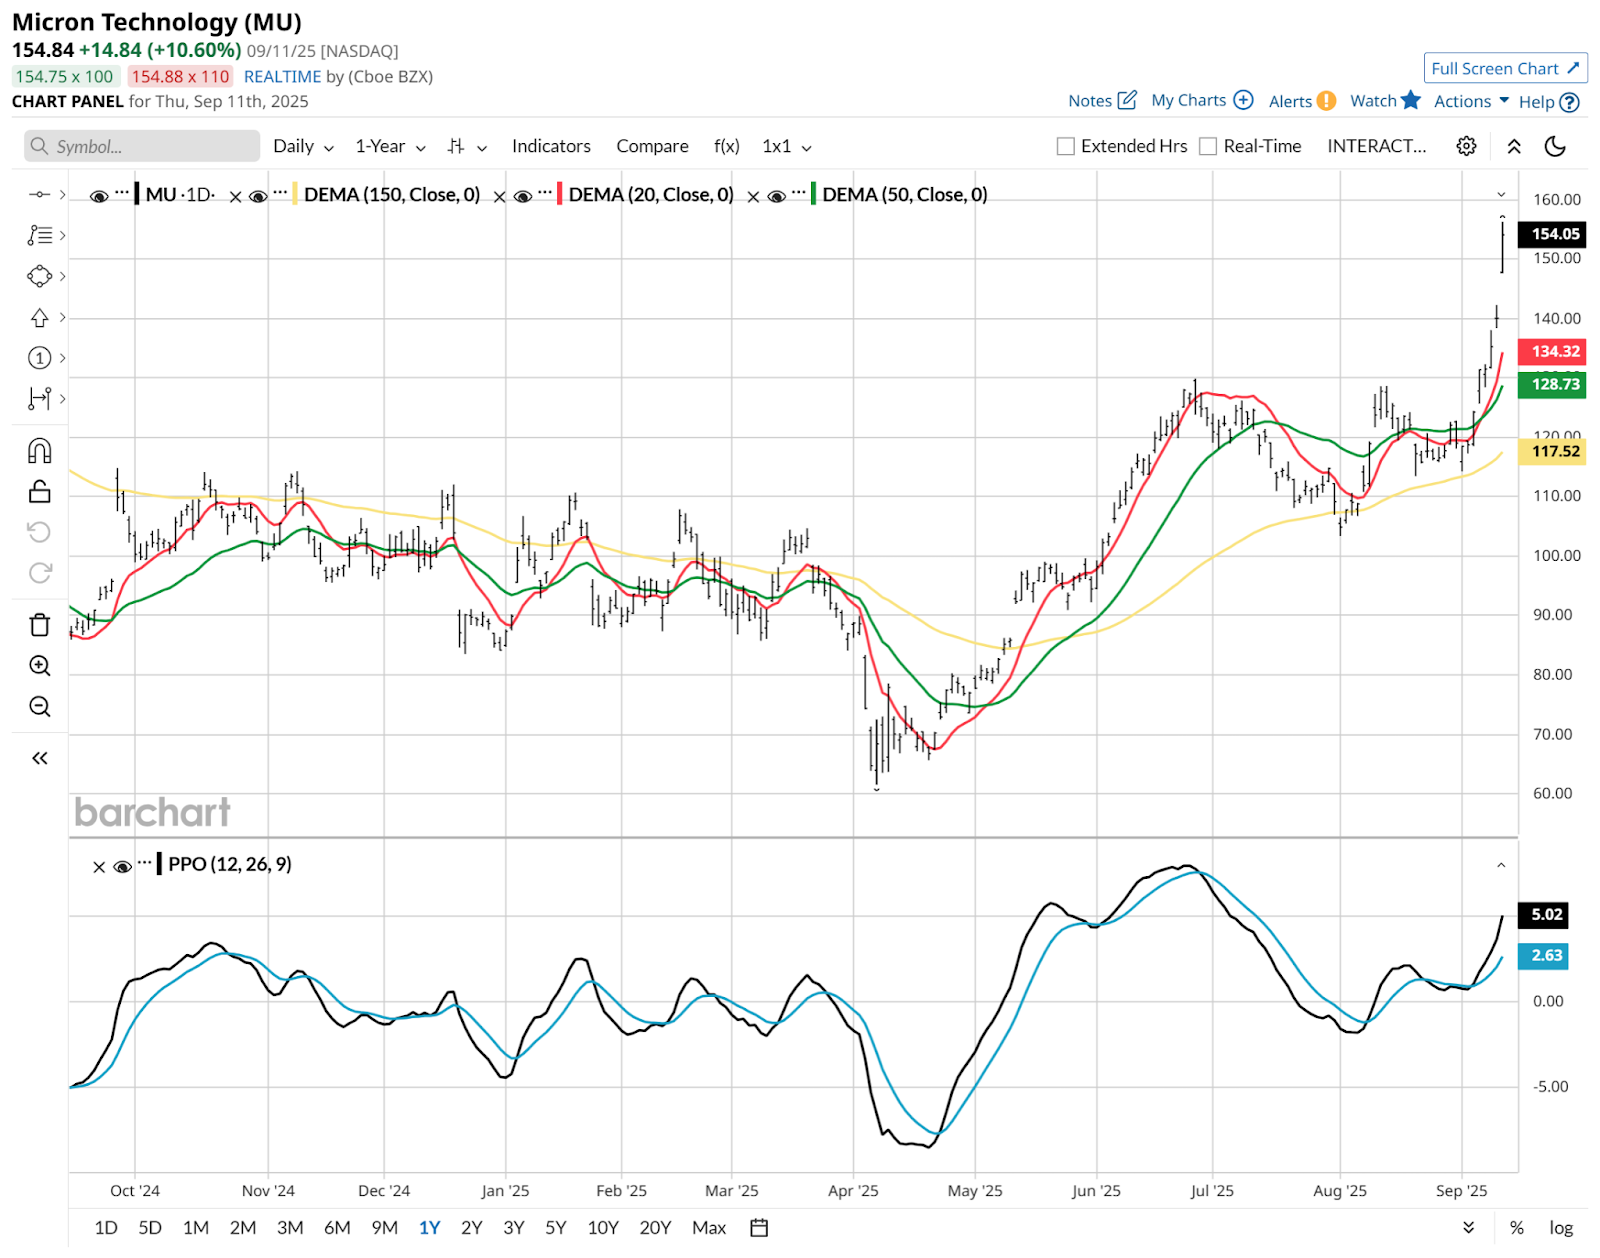
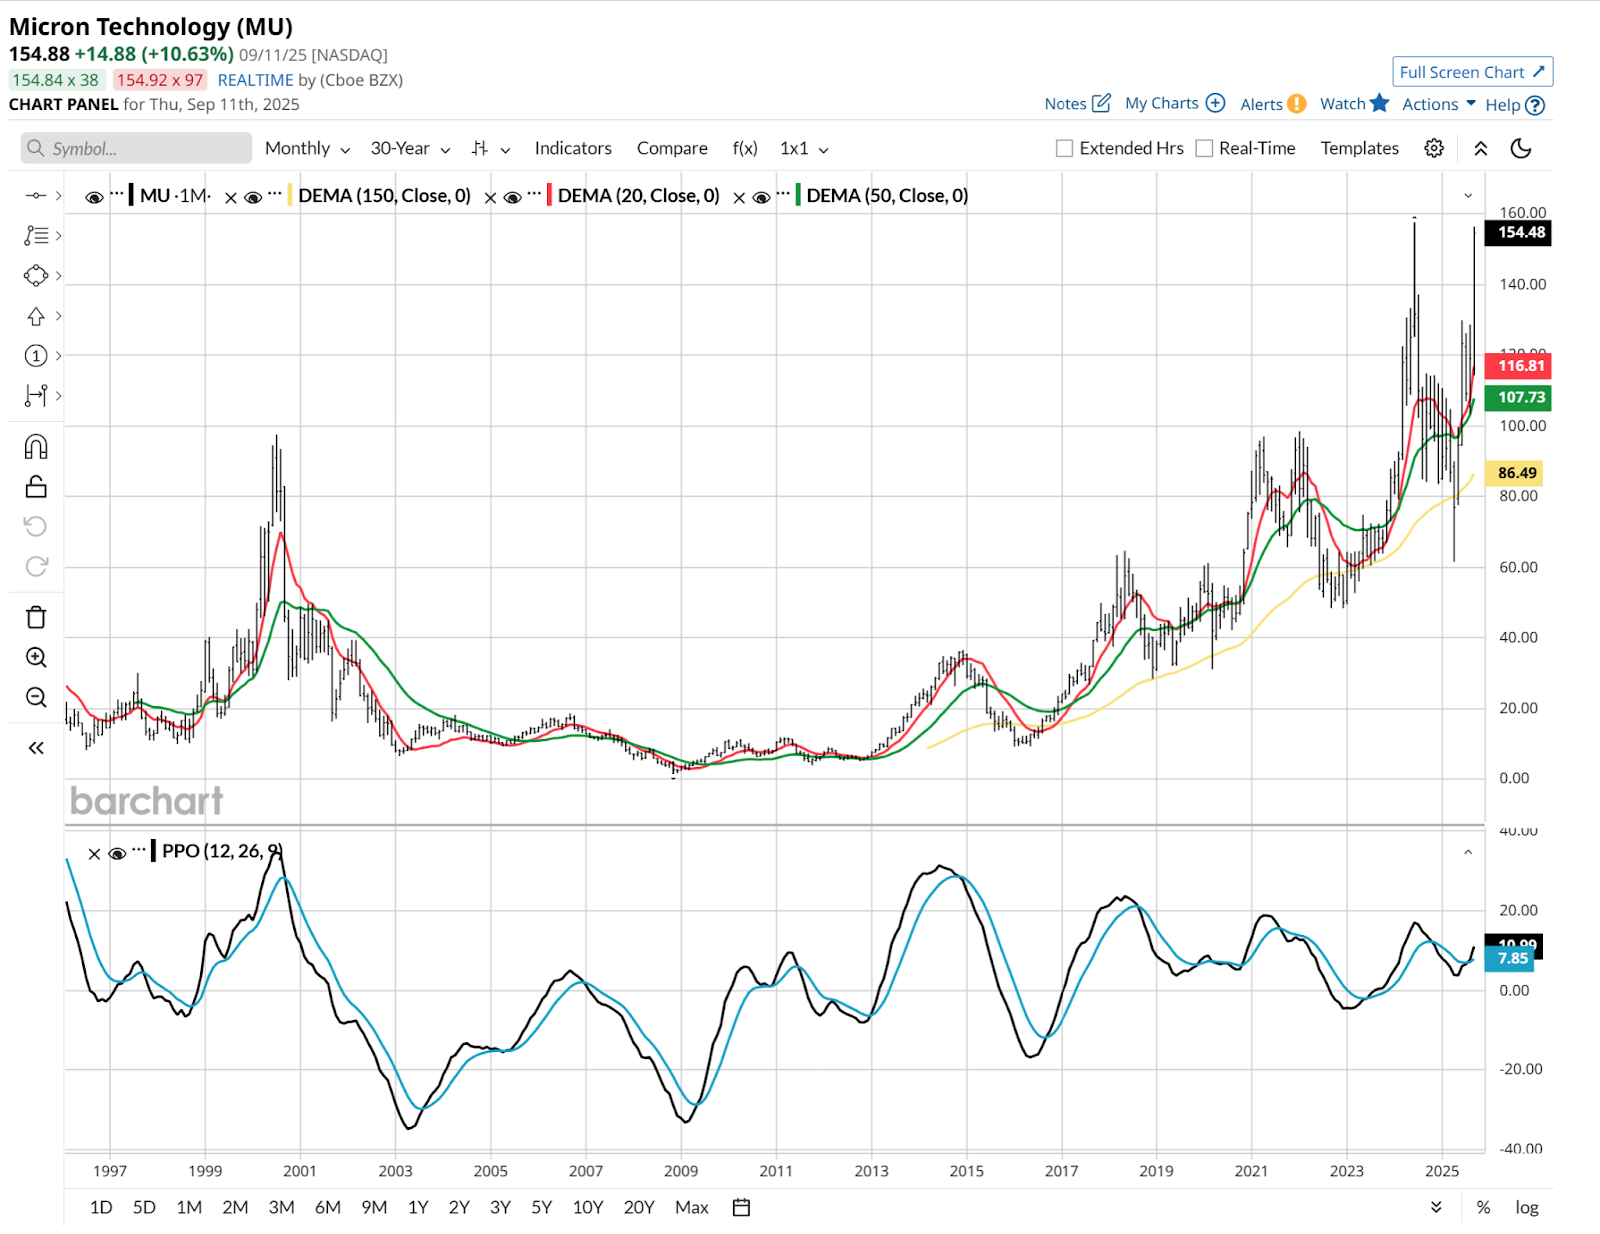
MU’s daily chart is obviously what I’d call “stretched.” But look at the PPO at the bottom. This stock has the ability to stretch out further to the upside. With a market so correlated within the tech sector, MU can go as far as the broader sector can take it. That said, remember that 1.5 beta. If tech flies, this stock is likely to fly more.
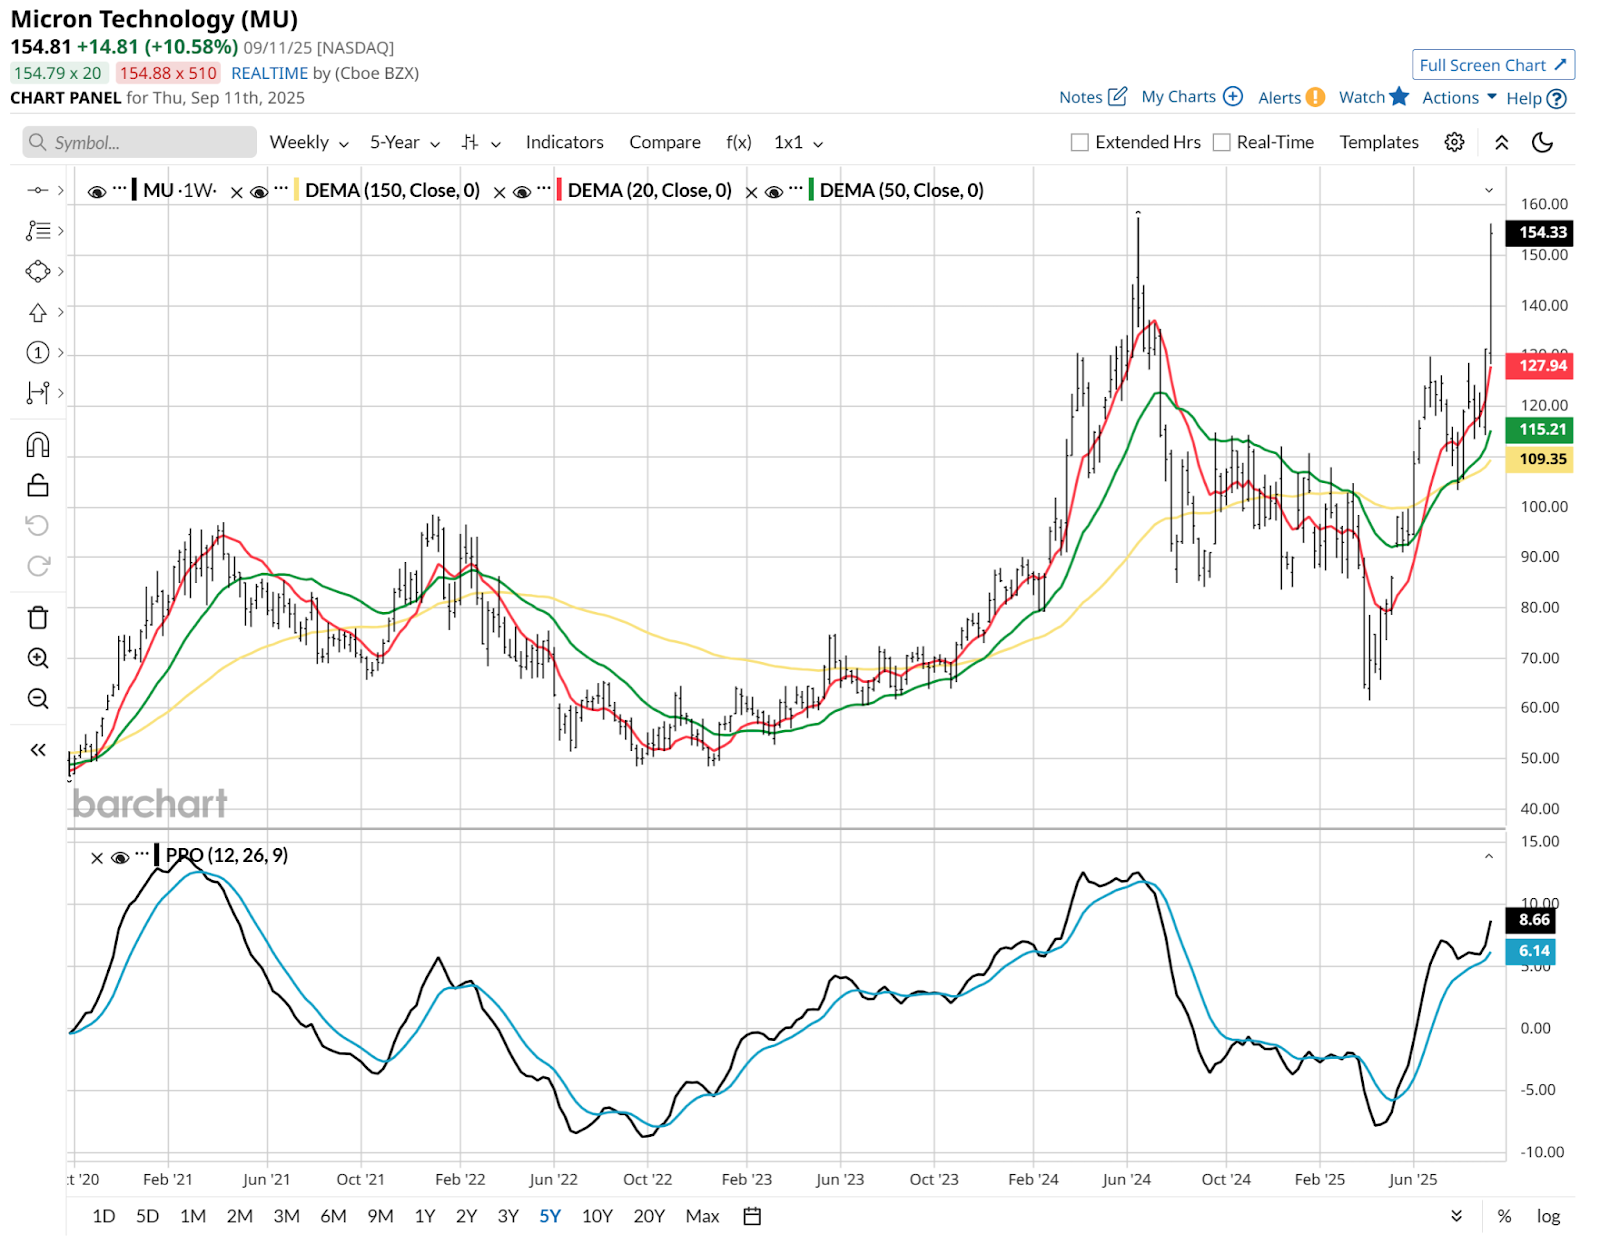
Next up, the weekly chart. It has a story to tell as well. It is the story of a fierce move into a double-top, but one that has still not caused the PPO to reach its prior peak. In English: The stock is certainly vulnerable after such a move, but it is not showing the “out of gas” picture I often see after such a move.
The monthly goes all the way back to the dot-com bubble, and we see that there’s more upside room from here.
My View: This Stock Is Not a Buy or Sell. It’s a Collar.
And here is one of many possible ways to do that. I treated this like it was 1998, not 2000. For us old-timers, that means the market has much more to run before it cracks. As for MU, by going all the way out to December of next year, I can get up to 21% upside versus just 5% downside risk.
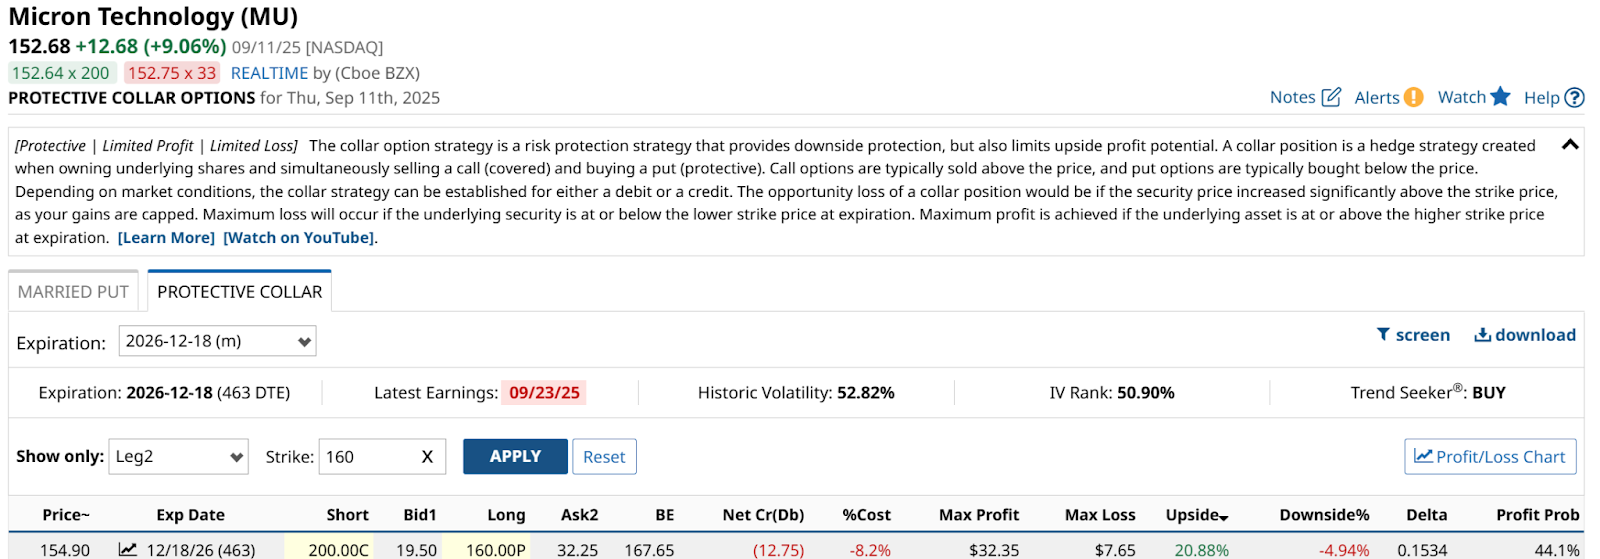
More than 4:1 on a stock already up this much? Yes, that’s the collar in action, in a volatile market, with a liquid stock.
The drawback is the cost. It is 8%, which means MU has to reach $167.65 for me to break even. But with a stock this volatile, being too concerned about that over a 16-month time frame is like picking up pennies in front of a steamroller.
The goal here is to be there if MU continues to rally, but to establish a floor that will only cost me 5% if the stock’s magic run ends harshly. This was an example using MU, but similar logic can be applied to many tech stocks in this wild market.