Meta Platforms (META) stock has been on a tear.
The shares are going for their fourth straight weekly gain, and they're up almost 25% in that stretch.
Shares of the social-media stalwart exploded in the first quarter, gaining more than 75%. That trounced its FAANG peers, with Apple (AAPL) being the next best performer in the quarter, up about 27%.
In fact, Meta ultimately passed Tesla (TSLA) in Q1 performance and — when it comes to large cap tech — trailed only Nvidia (NVDA) and its 90% gain.
All of which begs the question of whether the rally can continue.
Don't Miss: Tesla Stock Dip: Here's Where the Shares Find Support
Meta did not fare well in the 2022 bear market, posting a peak-to-trough decline of 77% from its September 2021 high down to the November 2022 low.
But several rounds of cost cuts and layoffs have helped spur the stock price. And even after a massive rally from the lows — up almost 150% — the shares trade at just 21.5 times this year’s estimated earnings.
While that’s a tad rich for a stock with only modest growth forecasts, it does leave room to justify more gains.
Can Meta Stock Continue to Rally?
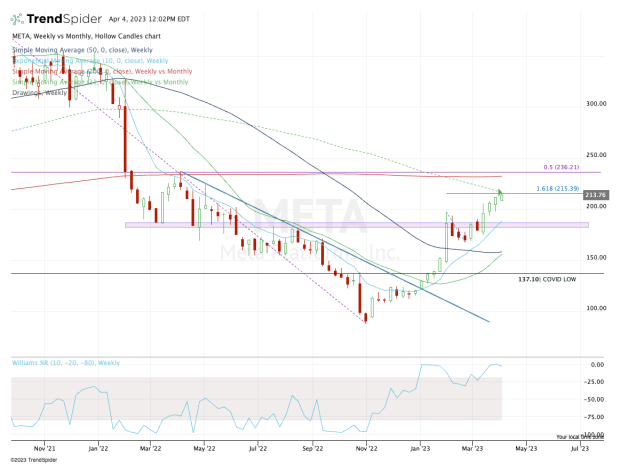
Chart courtesy of TrendSpider.com
Meta stock has now rallied in five straight months.
The shares broke out of a strong downtrend (blue line) and have been surging ever since. Now, though, there's reason for a pause.
Meta stock is running into the declining 21-month moving average and the 161.8% upside extension from the prior pullback in February.
Don't Miss: What the Technicals Say for the S&P 500, Nasdaq in the Second Quarter
Still and all, while the stock may be a bit extended, the current trend is very bullish. That should have active investors and traders looking for a pullback to buy.
Specifically, I’d keep a close eye on the $193 to $197 area. Depending on the strength of the overall market, that zone could be $197 to $200.
Either way, this area was prior resistance and most recently support. If it aligns with the 10-week moving average, then all the better for a dip-buying opportunity.
If the stock continues higher instead of pulling back, look for a potential test of the $232 to $235 zone. That’s the 200-week moving average and the 50% retracement of the entire pullback.
For traders with a long position, this would be a reasonable profit-taking zone. The stock at last check was trading around $213.
Action Alerts PLUS offers expert portfolio guidance to help you make informed investing decisions. Sign up now.