
One of the most powerful uses of the Average Directional Index (ADX) is to confirm Directional Indicator (DI) crossovers that can signal buying opportunities.
In a recent live webinar, John Rowland, CMT, demonstrated how DI crossovers can create actionable buy and sell signals, using the Invesco QQQ Trust (QQQ) as an example.
What DI Crossovers Mean
- +DI line over –DI line = Bull signal
- –DI line over +DI line = Bear signal
This creates a straightforward visual of when bullish or bearish momentum is taking control.
The Problem: Too Many Signals
Markets often chop sideways, generating multiple DI crossovers in a short span. Without confirmation, these clusters of signals create “noise” that can lead to whipsaws and frustration.
That’s where ADX comes in to help flag actionable buy and sell signals.
Confirming with ADX
In John’s QQQ example, several crossovers occurred while the DI lines were below 25. These weren’t reliable. But once the +DI crossed over the –DI and ADX pushed above 25, it confirmed a strong bullish signal.
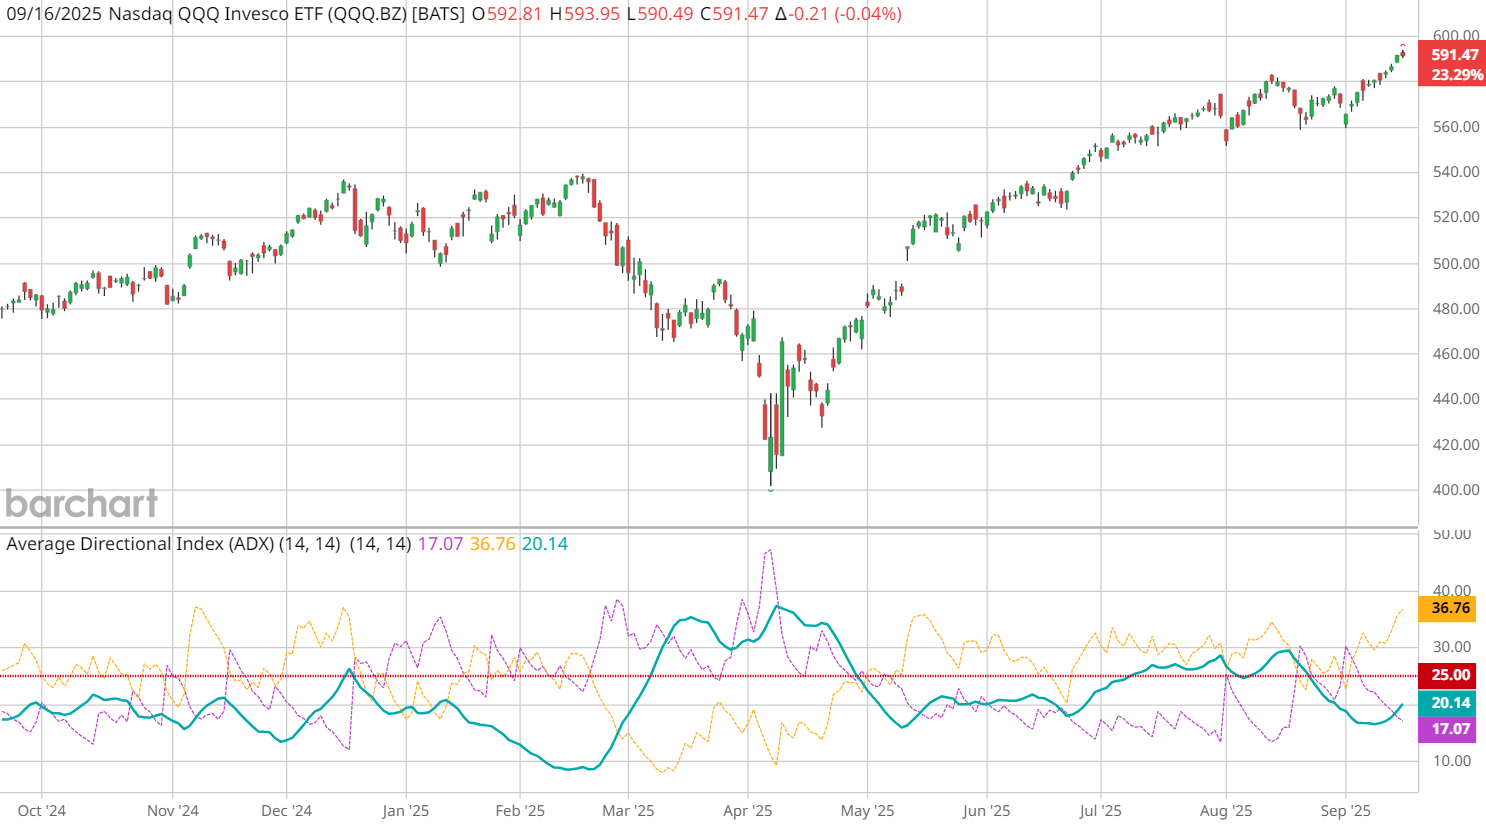
- ADX below 20 → Weak or non-directional market
- ADX above 20 → Trend may be emerging
- ADX above 25 → Strong, confirmed trend
This simple confirmation helps traders avoid false starts and stick with higher-probability trades.
How to Apply This with Barchart Tools
- Add ADX + DI indicators on Barchart Interactive Charts.
- Use the Barchart Opinion page to confirm overall bullish/bearish sentiment.
- Pair with Barchart’s Trader’s Cheat Sheet for additional support/resistance levels to plan entries and exits.
Bottom Line
DI crossovers can provide clear buy/sell signals — but work best when confirmed by ADX strength. By waiting for DI lines and ADX to rise above 20 or 25, traders can filter out the noise and focus on the trades that matter.
Watch the clip from John Rowland’s webinar to see the QQQ example in action:
- Catch the full ADX webinar replay for a deeper dive.
- Learn how to use ADX + RSI to avoid false signals on breakouts.