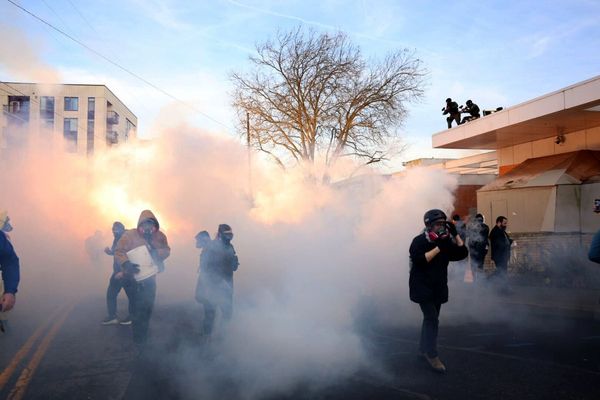
An analysis of hour-by-hour particulate matter levels in 2023 shows that many Indian cities registered this year’s highest pollution levels around Deepavali day (November 12). In seven Indian cities analysed — Delhi, Noida, Gurugram, Lucknow, Ahmedabad, Chennai, and Kolkata — the hourly pollution levels crossed the 500 micrograms per cubic meter ( μg/m3) mark around Deepavali day.
Pollution during Deepavali spikes due to firecrackers. The Chest Research Foundation of India in Pune carried out experiments in 2016 to measure the amount of PM 2.5 particles released by firecrackers during Deepavali. The experiments showed a significant increase in pollution, with the snake tablet firecracker emitting a peak level of 64,500 μg/m3 of PM 2.5, which are tiny particles with a diameter of 2.5 microns or less.
Chart 1 | The charts shows PM 2.5 levels in μg/m3 recorded every hour between January 1, 2023 and November 14, 2023 in a measuring station across select cities. Each circle in the chart depicts the average PM 2.5 level in a one-hour period in a city. The higher a circle is placed, the more the PM 2.5 particulate level. Hourly readings just before, after, and on Deepavali day are highlighted. The highest-ever pollution level recorded in an hour just before, after, and on Deepavali day is annotated in the graphs.
Chart shows PM 2.5 levels in μg/m3 recorded every hour between January 1, 2023 and November 14, 2023 in a measuring station across select cities in the North
Charts appear incomplete? Click to remove AMP mode
For instance, in Delhi’s Anand Vihar, between 11 p.m. on November 12 and 12 a.m. the next day, PM2.5 readings peaked at 957 μg/m3. This is the highest reading in the station for this year till November 14. On seven different hours around Deepavali day, Anand Vihar recorded PM2 .5 levels more than 500 μg/m3.
A similar analysis shows that Noida’s PM2.5 levels peaked at 716.5 μg/m3 between 9 p.m. and 10 p.m. on November 12 and Gurugram’s levels peaked in the same period at 567 μg/m3. Lucknow’s hourly PM2.5 levels peaked at 696 μg/m3 between 12 a.m. and 1 a.m. on November 13 (the day after Deepavali). Except for Gurugram, the other northern cities recorded their pollution peaks around Deepavali day. Hourly readings are important. This is because the impact is relatively less felt if the pollution peak is achieved at a time when most people are indoors.
Chart shows PM 2.5 levels in μg/m3 recorded every hour between January 1, 2023 and November 14, 2023 in a measuring station across select cities in the West
Ahmedabad’s Deepavali day pollution levels peaked at 999 μg/m3 — possibly because most pollution measurement devices can measure only to that extent — between 2 a.m. and 3 a.m. on November 13. This peak number in Ahmedabad was double the peak number in the city on a non-Deepavali day (May 11: 459 μg/m3). Jaipur and Patna also recorded high levels of pollution on Deepavali day, but not record levels. Mumbai recorded very low levels of pollution, while Kolkata recorded peak pollution on Deepavali day.
Chart shows PM 2.5 levels in μg/m3 recorded every hour between January 1, 2023 and November 14, 2023 in a measuring station across select cities in the East
Pollution peaked during Deepavali day in the southern cities of Amaravathi, Chennai, and Hyderabad. While Bengaluru too recorded very high levels on that day, it did not break the city’s record this year.
Chart shows PM 2.5 levels in μg/m3 recorded every hour between January 1, 2023 and November 14, 2023 in a measuring station across select cities in the South
Other types of pollutants also breached their 24-hour limits on Deepavali day. These include carbon monoxide, atmospheric ammonia, nitrous oxide (NO), nitrogen dioxide (NO2), PM10 (particulate matter equal to or less than 10 microns) and sulphur dioxide (SO2). For instance, NO levels in Delhi on Deepavali day peaked at 140 μg/m3 (limit is 80 μg/m3). Exposure to NO2 and NO impacts lung function. The World Health Organization reports that days with elevated levels of SO2 are associated with increased hospital admissions for heart disease.
vignesh.r@thehindu.co.in, rebecca.varghese@thehindu.co.in
Source: Central Pollution Control Board
Also read | How Diwali continues to be a festival that transcends religious barriers
Listen to our podcast | Examining the 70-Hour Work Week: Insight or Imposition by Infosys’ Narayana Murthy


