
Most traders jumping into the field of technical analysis learn about the Relative Strength Index (RSI) indicator first. Many also learn (the hard way) that “RSI overbought” is not an automatic sell.
In strong trends, RSI can stay overbought for weeks while price keeps marching higher. That’s where the Average Directional Index (ADX) — Welles Wilder’s trend-strength indicator — can save you from getting shaken out too early.
In a recent live webinar, John Rowland, CMT walked through a clean approach on Microsoft (MSFT): reference RSI for momentum conditions, and use ADX for trend strength/confirmation. Below is the distilled playbook so you can put it to work, along with links to the short explainer clip and the full webinar for deeper training.
What RSI Really Says (and What It Doesn’t)
- RSI > 70 = overbought condition, not an automatic sell.
- RSI < 30 = oversold condition, not an automatic buy.
An actionable RSI signal is often the indicator’s exit from those zones (e.g., RSI falls out of >70). But that signal can be weak when viewed in isolation, especially during powerful trends.
What ADX Tells You
ADX measures trend strength, not direction.
A rising ADX indicates a strengthening trend, while a falling or flattening ADX suggests that momentum is wearing thin.
Common guideposts for using ADX include:
- < 20: weak/choppy trend
- 20–25: building/borderline
- > 25: trending
Optionally, use Wilder’s companion lines, +DI / –DI, for directional bias.
Why Combine RSI + ADX?
Because context turns a “maybe” into a plan:
- If RSI exits overbought territory but ADX is still rising, the uptrend is still strengthening – which means that RSI dip may be noise (an early/false sell signal).
- If RSI exits overbought and ADX rolls over (stops rising and turns down), that’s a stronger warning of trend fatigue – meaning it’s time to manage risk, take partial profits, and tighten stops.
- Bearish divergence adds conviction: this is when price makes higher highs while RSI makes lower highs — and if ADX also stalls after rising, odds of a pullback increase.
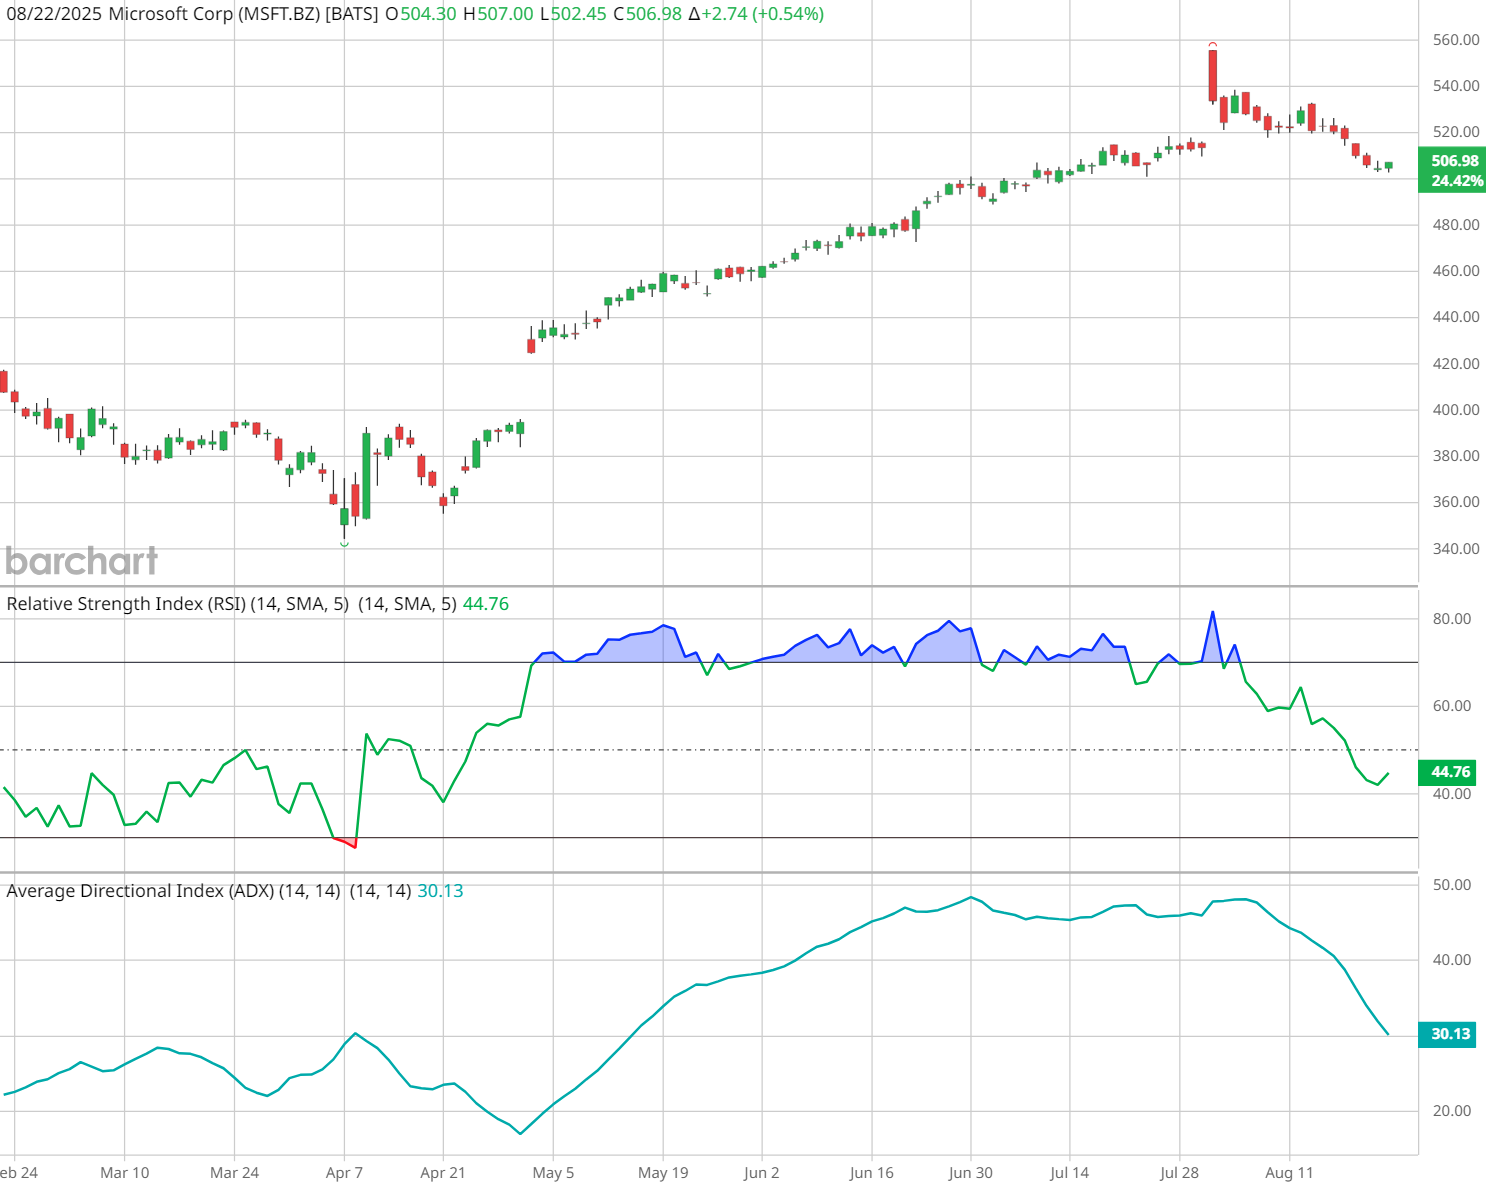
John’s MSFT Example
Check out the MSFT example in John’s webinar to see this play out on the charts:
- Setup: MSFT in a strong uptrend; ADX elevated (trend strong) but beginning to flatten.
- RSI falls out of overbought — alone, that would look like a sell.
- Cross-check: ADX is still strengthening → not a high-quality RSI sell signal.
- Higher-quality signal: wait for ADX to turn down while RSI falls, or spot bearish divergence on RSI as price grinds higher.
- Tactical takeaway: In strong trends, consider risk management (scale out/raise stops) rather than flipping short on the first RSI exit.
A 3-Step Playbook You Can Use & Reuse
-
Identify conditions
- Is RSI > 70 (overbought) or < 30 (oversold)? Note any divergence.
-
Confirm context with ADX
- Is ADX rising/elevated (trend strength building) or flattening/falling (trend weakening)?
-
Choose action
- RSI exit + rising ADX → stay with trend; dips may be noise.
- RSI exit + ADX turning down → tighten stops, scale profits, or consider hedges
- Add divergence (price vs. RSI) to upgrade/de-rank the signal.
How to Do This on Barchart (Fast)
1) Chart It Like John
- Search MSFT → Interactive Chart.
- Indicators → add RSI(14) and ADX(14) (optionally, include +DI/–DI).
- Save as a Chart Template so you can apply it to any symbol in one click.
- Use Flipcharts to scan through a watchlist with the same template.
2) Screen for Candidates
-
Stock Screener → add Indicators filters:
- ADX(14) ≥ 25 (trend strong)
- RSI(14) > 70 (overbought) or falling below 70
- Save the screener and turn on email alerts so qualifying symbols hit your inbox daily.
3) Build & Monitor
- Create a watchlist (e.g., “ RSI>70 + ADX Strong”).
- From the watchlist, launch your saved screener or use New Recommendations to catch fresh buy and sell signals.
- Use these Trade Alerts for RSI cross-downs and ADX rollovers to time trims/hedges.
Risk Management Tips (Don’t Skip These)
- Size small; add only if ADX keeps rising with price.
- Consider partial profit-taking when RSI diverges or ADX flattens.
- Use timeframes: confirm a 1-4 hour setup on the daily, or validate a daily with weekly trend.
- Remember: indicators guide probabilities, not certainties.
Keep Learning: Watch the Clip & Full Webinar
Quick Clip: This Stock Chart Indicator Helps You Avoid False Sell Signals
Full Session: ADX Trading Strategy: Profit From Massive Market Moves
Learn ADX with +DI/–DI, how to filter chop, and how to combine RSI, moving averages, and multi-timeframe analysis to ride trends longer and exit smarter.