If you’ve ever been shaken out of a good trade by one ugly red candle, you’re not alone.
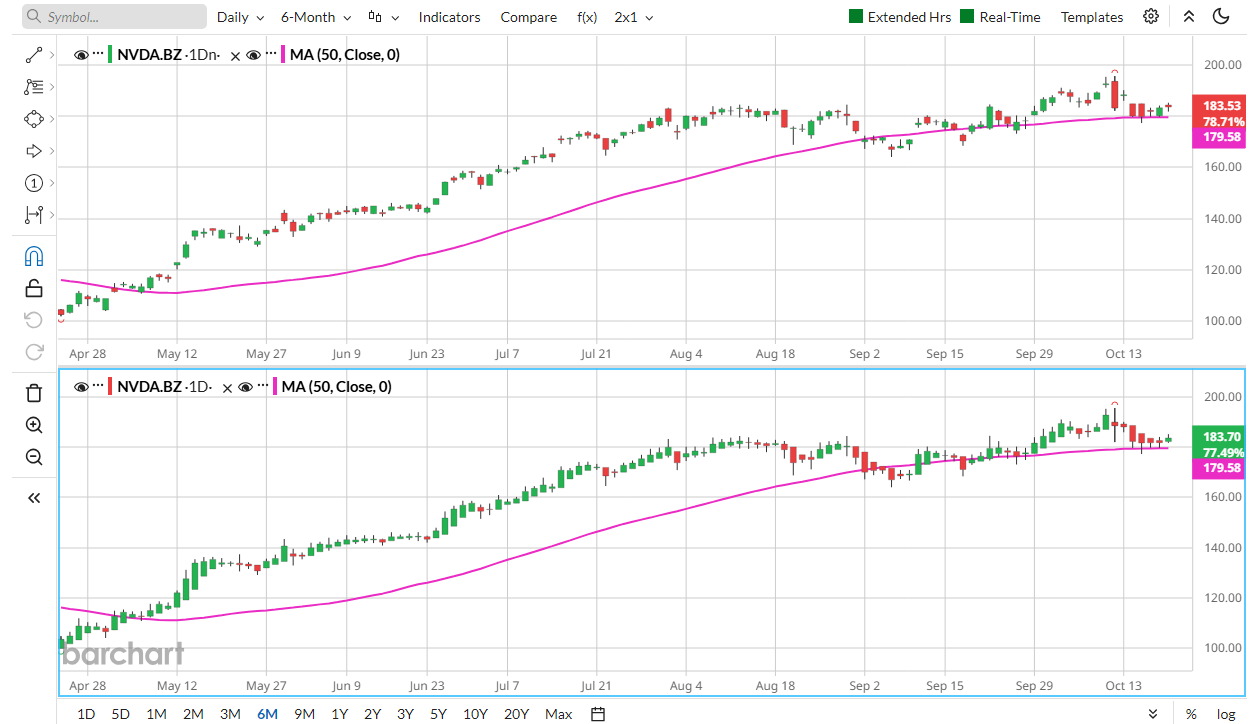
In his latest webinar, Barchart’s Senior Market Strategist John Rowland breaks down the difference between traditional Japanese candlesticks and the smoother, more modern Heikin-Ashi approach — using NVIDIA (NVDA) as a real-time example.
What he shows is simple but powerful: Heikin-Ashi can help traders stay focused on the trend instead of overreacting to short-term volatility.
1. Traditional Japanese Candlesticks: The Classic Storytellers
Japanese candlesticks have been the foundation of technical analysis for centuries. Each candle tells the story of a single trading session — showing where price opened, how high and low it went, and where it closed.
Why traders like them:
- Every candle shows real market prices.
- Patterns like engulfing candles, hammers, and dojis reveal potential reversals.
- They capture market emotion — fear, greed, hesitation — in pure form.
But there’s a problem: that real-time window into investor emotion can also create confusion. When markets gap or swing wildly, it’s easy to misread noise as a signal.
As John points out in the clip:
“That red candle might have shaken you out of a long position. Using traditional Japanese candlesticks, this could look like a sell signal. But Heikin-Ashi tells us to wait — to confirm a real change in control.”
2. Heikin-Ashi: The Noise-Cancelling Chart
Heikin-Ashi candlesticks use a different formula — blending the open, high, low, and close of both the current and previous candles to create a smoother representation of price action.
What this does:
- Eliminates many of the price gaps you see on traditional charts.
- Reduces short-term “chop” that can trigger premature entries or exits.
- Highlights the dominant trend more clearly.
Instead of reacting to every red candle, traders can wait for a confirmed color change and smoother transition in control before making a move.
“Heikin-Ashi tells us, ‘Don’t panic yet.’ Wait until you see control shift,” John explains while showing NVDA’s chart.
3. Why Heikin-Ashi Works for Trend Traders
Bullish trends appear as a series of green candles with small or no lower shadows, while bearish trends show red candles with small or no upper shadows.
This makes trend strength instantly visible — no need to guess.
Heikin-Ashi candlesticks shine when used for:
- Trend following: Staying in profitable moves longer without reacting to short-term volatility.
- Swing trading: Spotting transitions between bullish and bearish phases.
- Confirming signals: Combine with moving averages or RSI to confirm reversals.
4. When to Use Each Type
Don’t throw out the classics, though. Use traditional Japanese candlesticks when you need precise entry and exit data or want to analyze exact price levels and patterns.
Use Heikin-Ashi when you want to stay focused on trend strength, momentum, and market direction — without being chopped out by daily noise.
Many traders use both candlestick types side by side with Barchart’s Grid Charts for the full picture.
5. Explore These Tools on Barchart
Ready to apply what John teaches? Try these steps:
- Open Barchart Interactive Charts and switch between Candlestick and Heikin-Ashi views to compare signals.
- Combine Heikin-Ashi candles with indicators like RSI, MACD, or moving averages.
- Track key trend-driven names such as NVDA, Apple (AAPL), and SPY.
- Explore Barchart Webinars & Education for more guides from John Rowland.
The Takeaway
Traditional candlesticks show every heartbeat of the market, while Heikin-Ashi shows the rhythm. One gives you every detail. The other gives you direction.
When used together, they help traders balance precision with clarity — and that’s where real confidence begins.
Watch this quick clip showing Heikin-Ashi vs. Japanese Candlesticks →
- Watch the Full Webinar: How to Trade Heikin-Ashi Candlesticks →
- Learn more about the Top Chart Types for Traders & Investors on Barchart →