There was something for everyone in the latest UK economic data. Growth in the final three months of 2014 was revised up. That was good news for the government. The balance of payments deficit last year was the highest since modern records began in 1948. That was not so welcome.
But with an election five weeks away, the most interesting release from the Office for National Statistics was the one dealing with wellbeing. Living standards are key to the result on 7 May and here all sides can use the official data to weave their own narrative.
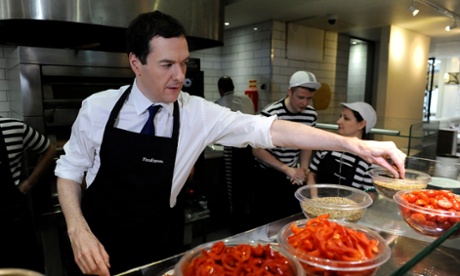
The chancellor, George Osborne, can say that living standards as measured by gross domestic product per head increased by 0.5% in the final quarter of 2014, continuing the steady upward trend since early 2013. The Conservatives would like voters to focus on what has happened over the last couple of years and forget about how tough things were in the first half of this parliament.
The ONS points out that GDP per head is still more than 1% below where it was at the start of the recession in early 2008. The sluggishness of the pickup in living standards is unprecedented in recent times.
That is even more the case if alternative yardsticks for measuring national wellbeing are used. The ONS also studies net national disposable income (NNDI) per head, which represents the income actually available to UK residents. This has remained broadly flat for the past three years and is still more than 5% below its pre-recession level.
There are two main reasons for the discrepancy between the two measures. GDP per head doesn’t take account of capital depreciation. Nor does it take account of the fact that some of the income generated in the UK goes overseas just as some of the income generated overseas is repatriated to the UK. For the past few years, the money flowing out of Britain has been much greater than the money flowing in. Hence the record balance of payments deficit and the flatlining of the NNDI measure of living standards.
Just to complicate matters, the ONS has a third measure of living standards, real household disposable income (RHDI) per head, which takes into account changes in mortgage rates, taxes and benefits. RHDI per capita actually rose strongly during the recession, because interest rates were slashed to 0.5%, the amount paid in taxes fell, and benefits increased.
But by 2011 the impact of these factors had worn off and real incomes were eroded by inflation. After bouncing around, RHDI is just about back to where it was when the coalition came to power in 2010, and is 2.2% above where it was when the recession began.
What does all this mean? Cutting through all the statistics, it is clear that living standards took a big hit during the recession and its aftermath, but are now recovering. The two key issues as far as the election are concerned are these: has the pickup come in time to generate a feelgood factor. And if it hasn’t, who will voters blame for the fact that their living standards are broadly unchanged on five years ago. Traditionally, voters tend to punish governments that fail to make them better off. The question is whether they will punish this government or the previous one.