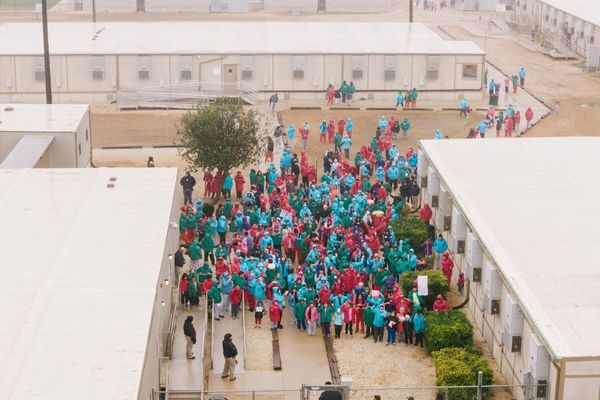
As part of the government's reporting on how the vaccine rollout is going around the country, it's now releasing more detailed information about vaccination rates by Local Government Area (LGA).
Previously, it was broken down by geographic areas and was a little broader than the information we have now.
The data means we have a somewhat clearer picture of how the vaccine rollout is progressing.
But unlike before, where remote areas in each jurisdiction were roughly grouped together, this time there is a large swathe of LGAs considered remote or very remote that the department isn't providing vaccine rates for.
Again, this data doesn't provide details on the average age of each area (which impacts the number of people who are eligible) or the supply rates of the vaccines.
Below is a state-by-state breakdown of the latest figures. If you'd like to look at the full list of LGAs you can find them here and the rest of the previous data sets from the Department of Health here.
- New South Wales
- Victoria
- Queensland
- South Australia
- Western Australia
- Tasmania
- Australian Capital Territory
- Northern Territory
New South Wales
Lowest rates:
First dose (%) |
Second dose (%) |
|
|---|---|---|
Edward River |
41.7 |
26.4 |
Balranald |
43.9 |
27.2 |
Muswellbrook |
47.1 |
21.7 |
Byron |
47.2 |
25.5 |
Highest rates
First dose (%) |
Second dose (%) |
|
|---|---|---|
Ku-ring-gai |
79.4 |
53.3 |
Murray River |
79.1 |
49.8 |
The Hills Shire |
78.5 |
46.6 |
Victoria
Lowest rates:
First dose (%) |
Second dose (%) |
|
|---|---|---|
Melbourne |
39.3 |
24.5 |
Hume |
40.8 |
22.4 |
Whittlesea |
43.2 |
25.6 |
Greater Dandenong |
43.2 |
24.1 |
Highest rates:
First dose (%) |
Second dose (%) |
|
|---|---|---|
Queenscliffe |
86.9 |
64.0 |
Surf Coast |
73.1 |
48.3 |
Buloke |
71.6 |
48.4 |
Queensland
Lowest rates:
First dose (%) |
Second dose (%) |
|
|---|---|---|
Cherbourg |
19.3 |
4.6 |
Isaac |
23.5 |
10.7 |
Yarrabah |
24.4 |
8.3 |
Highest rates:
First dose (%) |
Second dose (%) |
|
|---|---|---|
Goondiwindi |
73.0 |
50.6 |
Hinchinbrook |
59.2 |
40.6 |
Noosa |
57.7 |
33.6 |
South Australia
Lowest rates:
First dose (%) |
Second dose (%) |
|
|---|---|---|
Grant |
14.5 |
5.7 |
Playford |
37.0 |
22.1 |
Adelaide Plains |
39.0 |
22.9 |
Highest rates:
First dose (%) |
Second dose (%) |
|
|---|---|---|
Orroroo/Carrieton |
72.2 |
41.2 |
Victor Harbor |
67.7 |
44.7 |
Burnside |
66.2 |
46.8 |
Western Australia
Lowest rates:
First dose (%) |
Second dose (%) |
|
|---|---|---|
Chapman Valley |
28.0 |
14.2 |
Coolgardie |
28.6 |
14.9 |
Highest rates:
First dose (%) |
Second dose (%) |
|
|---|---|---|
Cottesloe |
77.2 |
53.1 |
Nedlands |
76.5 |
53.8 |
Tasmania
Lowest rates:
First dose (%) |
Second dose (%) |
|
|---|---|---|
Southern Midlands |
44.9 |
29.9 |
Brighton |
45.0 |
32.7 |
Kentish |
45.5 |
27.5 |
Highest rates:
First dose (%) |
Second dose (%) |
|
|---|---|---|
Tasman |
67.7 |
45.2 |
Hobart |
66.1 |
49.2 |
Kingborough |
64.2 |
46.2 |
Australian Capital Territory
First dose (%) |
Second dose (%) |
|
|---|---|---|
ACT |
63.4 |
40.3 |
Northern Territory
First dose (%) |
Second dose (%) |
|
|---|---|---|
Litchfield |
33.4 |
20.8 |
Palmerston |
52.2 |
33.6 |
Darwin |
69.7 |
47.2 |