The banks are generally viewed as the kickoff to earnings season, with many considering this morning’s earnings report from JPMorgan (JPM) and Morgan Stanley (MS) to be the unofficial start.
PepsiCo’s (PEP) report on Tuesday or Delta Air Lines’ (DAL) results on Wednesday could also have been the start, but that hardly matters
Especially when we’re fresh off a higher-than-expected inflation report and as JPMorgan — considered by many investors to be a best-in-breed bank — missed on earnings and revenue expectations and suspended its buyback.
JPM shares fell a bit more than 5% in trading on July 14, and they finished the day off 3.5%.
Further, Morgan Stanley also delivered a top- and bottom-line miss, while JPMorgan suspended its buyback in order to more quickly meet new capital requirements.
The report does not provide the best optics. But on a day where the markets were struggling, it's promising to see investors trying to buy the dip in JPMorgan stock on a bad headline number.
Trading JPMorgan Stock
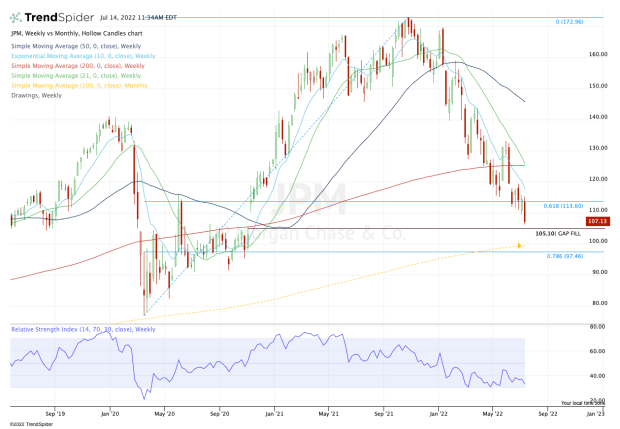
Chart courtesy of TrendSpider.com
Looking at the chart of JPMorgan stock, just a little bit more downside would have been ideal this morning. That’s so the stock would have filled the open gap down at $105.10 from November 2020.
Of course, it’s always possible it goes on to do so, which is something investors should keep in mind. A gap-fill could act as a “job well done” catalyst, enabling JPMorgan stock to bounce.
If it does rally — with or without filling the gap — then there are a few upside levels to keep in mind.
The first is today’s gap-fill level, which is up at $110.38. Above that and the $115 to $116 level is of interest. This zone was support in May, but has been resistance this month.
Near that area is also the declining 10-week moving average, which has been active resistance since the stock fell below it in January.
The stock moving above all these measures opens the door to the 21-week and 200-week moving averages, up near $125.
On the downside, a break of the $105 level likely puts $97.50 to $100 in play. In that zone we find the 78.6% retracement from the 2020 low to the all-time high, along with the 100-month moving average, which was support near the 2020 low.