
JPMorgan (JPM) and other bank stocks have been caught in a wave of volatility lately.
Specifically, JPMorgan has held up better than other names, but its shares have still suffered a peak-to-trough decline of 14.5% this month.
The Financial Select Sector SPDR Fund (XLF) has been hammered, along with regional-bank stocks — like those in the SPDR S&P Regional Banking ETF (KRE).
The fallout from various bank failures, including SVB Financial and Signature Bank, have created worries for investors and risks for the banking industry.
Don't Miss: Buy the Dip in Nvidia Stock? Check the Chart First
While regional banks are seeing an outflow of deposits, the large banks like JPMorgan are seeing inflows, as are money market funds.
Not to mention, these banks are better capitalized than their regional counterparts, making them safer investments.
That said, there are lingering worries about bank stocks, both from a regional-banking perspective and from an economic standpoint. While JPMorgan would survive a recession, it doesn’t mean the stock will be immune.
Let’s look at the chart.
Trading JPMorgan Stock
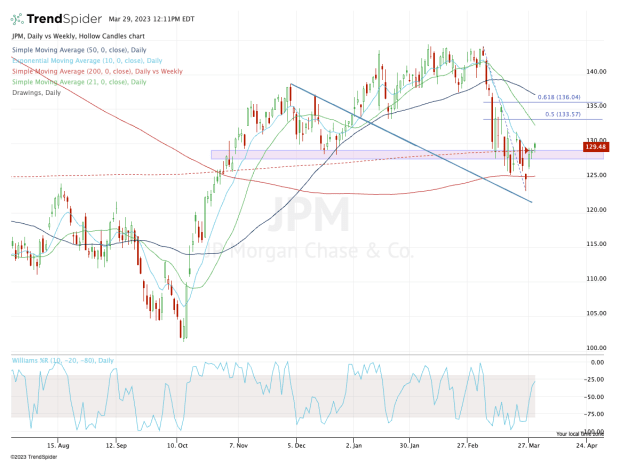
Chart courtesy of TrendSpider.com
JPMorgan stock underwent something of a landslide during March, going from the prospects of a breakout over the $144 to $145 area to hoping it could hold onto the 200-day moving average.
While the stock technically closed below that measure on Friday, March 24, it has quickly regained the 200-day -- and then some.
The stock is working on its third straight daily rally. Amid that stretch, JPMorgan shares have reclaimed the 10-day and 200-week moving averages, as well as the key $128 to $129 area.
This area was resistance amid the October rally, and then following the breakout over this level, it was support in December.
Don't Miss: The Market Has a Taste for PepsiCo Stock: Chart
So what now?
The bulls will want to see JPMorgan stock hold the key measures it just regained. If it can’t, it opens the door back down to the 200-day moving average (near $125), as well as the the March low near $123.
If the shares continue higher, the $133 level and the 21-day moving average are next, followed by the $136 level and the 50-day moving average.
Get investment guidance from trusted portfolio managers without the management fees. Sign up for Action Alerts PLUS now.