
Ford Motor Co (NYSE:F) shares are trading higher Thursday after a bullish day in the general markets on Wednesday helped the stock close up over 2%.
The legacy-turning-electric vehicle manufacturer has spent the last five trading days consolidating after a massive six-day post earnings ramp saw Ford soar 26% between July 27 and Aug. 3.
The massive surge coincided with the break up from a bull flag pattern on the daily chart, which Benzinga pointed out just prior to the company’s second-quarter earnings print.
It now appears Ford may be completing a second consecutive flag within a bull flag pattern.
The bull flag pattern is created with a sharp rise higher forming the pole, which is then followed by a consolidation pattern that brings the stock lower between a channel with parallel lines or into a tightening triangle pattern.
For bearish traders, the "trend is your friend" (until it's not) and the stock may continue downward within the following channel for a short period of time. Aggressive traders may decide to short the stock at the upper trendline and exit the trade at the lower trendline.
- Bullish traders will want to watch for a break up from the upper descending trendline of the flag formation, on high volume, for an entry. When a stock breaks up from a bull flag pattern, the measured move higher is equal to the length of the pole and should be added to the lowest price within the flag.
- A bull flag is negated when a stock closes a trading day below the lower trendline of the flag pattern or if the flag falls more than 50% down the length of the pole.
Want direct analysis? Find me in the BZ Pro lounge! Click here for a free trial.
The Ford Chart: Ford appears to be printing another bull flag, with the pole formed between July 27 and Aug. 3 and the flag forming over the days that have followed. If the pattern is recognized, the measured move suggests Ford could surge toward the $20 level.
- The sideways trading within the flag has helped to cool Ford’s relative strength index (RSI), which had been registering in above 70% since July 27. The stock’s RSI has cooled to about 66%, and although the level is more conformable, continued consolidation within the flag would keep Ford’s RSI from becoming overextended too quickly on a break up from the flag.
- Ford’s bull flag is taking place about 7% beneath the 200-day simple moving average (SMA). It’s common to see strong consolidation patterns take place under heavy resistance areas, such as the 200-day SMA, and the sideways trading under the area can help a stock gather the power to regain the level as support.
- If the bull flag pattern is recognized and Ford breaks up above the 200-day SMA, the stock will also be in close proximity to filling an overhead gap that exists between $18.59 and $19.87. Gaps on charts fill about 90% of the time, so it’s likely the stock will rise up to fill the range at some point in the future.
- Ford has resistance above at $15.51 and $16.45 and support below at $14.34 and $12.79.
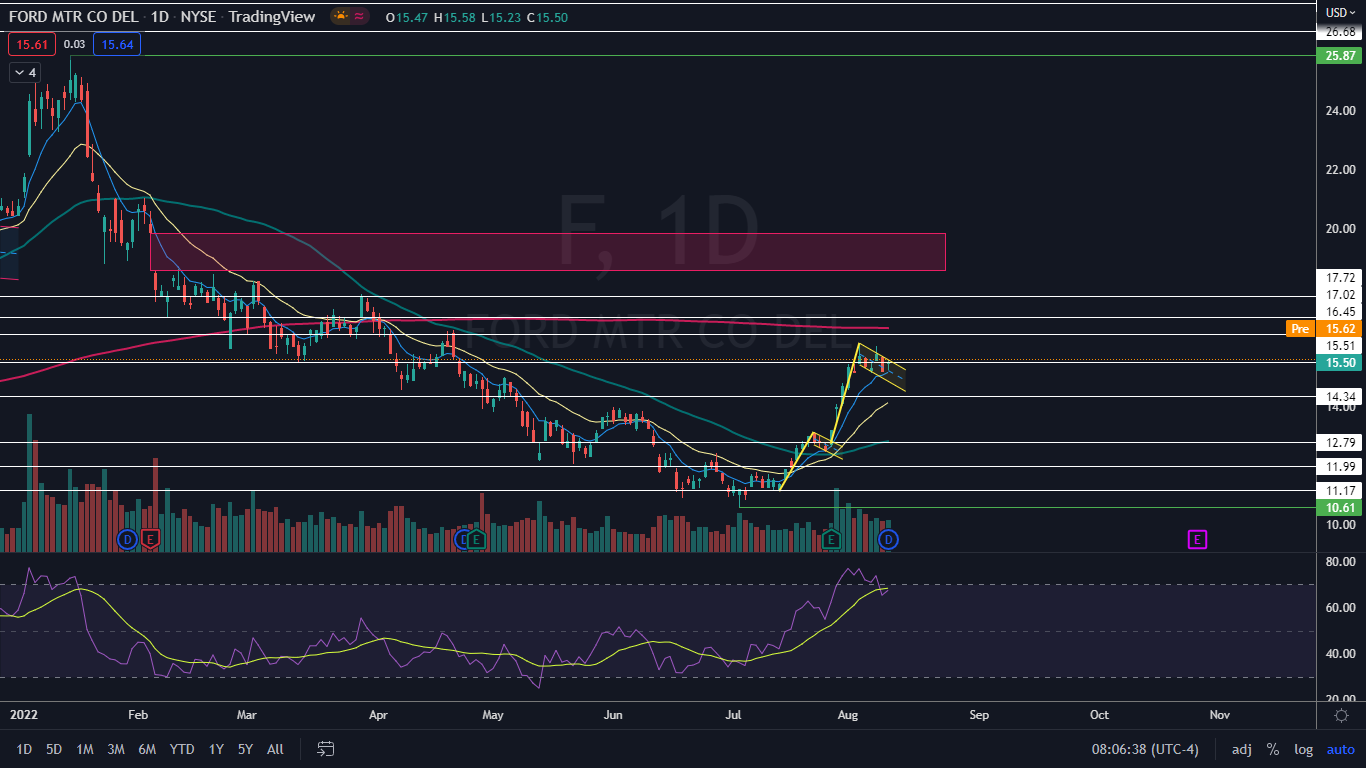
Photo via Shutterstock.