
Bank of America Corp (NYSE:BAC) was trading flat on Thursday in continued consolidation after soaring up more than 13% between July 14 and July 19. The sharp rise paired with the sideways consolidation has settled the stock into a possible bull flag pattern.
The bull flag pattern is created with a sharp rise higher forming the pole, which is then followed by a consolidation pattern that brings the stock lower between a channel with parallel lines or into a tightening triangle pattern.
- For bearish traders, the "trend is your friend" (until it's not) and the stock may continue downwards within the following channel for a short period of time. Aggressive traders may decide to short the stock at the upper trendline and exit the trade at the lower trendline.
- Bullish traders will want to watch for a break up from the upper descending trendline of the flag formation, on high volume, for an entry. When a stock breaks up from a bull flag pattern, the measured move higher is equal to the length of the pole and should be added to the lowest price within the flag.
- A bull flag is negated when a stock closes a trading day below the lower trendline of the flag pattern or if the flag falls more than 50% down the length of the pole.
Want direct analysis? Find me in the BZ Pro lounge! Click here for a free trial.
The Bank of America Chart: Bank of America’s bull flag pattern has been printing since July 14, with the pole forming over the first three trading days of that time frame and the flag forming over the days that have followed. If the pattern becomes recognized and Bank of America breaks up bullishly from the upper descending trendline of the flag, the measured move could shoot the stock up toward the $38 level.
- When Bank of America soared up to print the pole of the bull flag, the stock also negated its downtrend. If Bank of America breaks up bullishly from the flag pattern, the stock will print a higher high, which would confirm a new uptrend. If that happens, the July 20 low-of-day may serve as the higher low within the pattern.
- The stock was also printing a double inside bar pattern on the daily chart, with the mother bar forming on Tuesday and the inside bars forming over Wednesday and Thursday. The inside bars lean bullish because Bank of America was trading higher before forming the pattern.
- Bank of America’s volume has been declining over the past three days, which indicates consolidation is taking place and is what would be expected in a flag and inside bar pattern. At press time, about 10 million Bank of America shares had exchanged hands compared to the 10-day average of 45.24 million.
- The stock has resistance above at $33.99 and $35.72 and support below at $32.77 and $30.86.
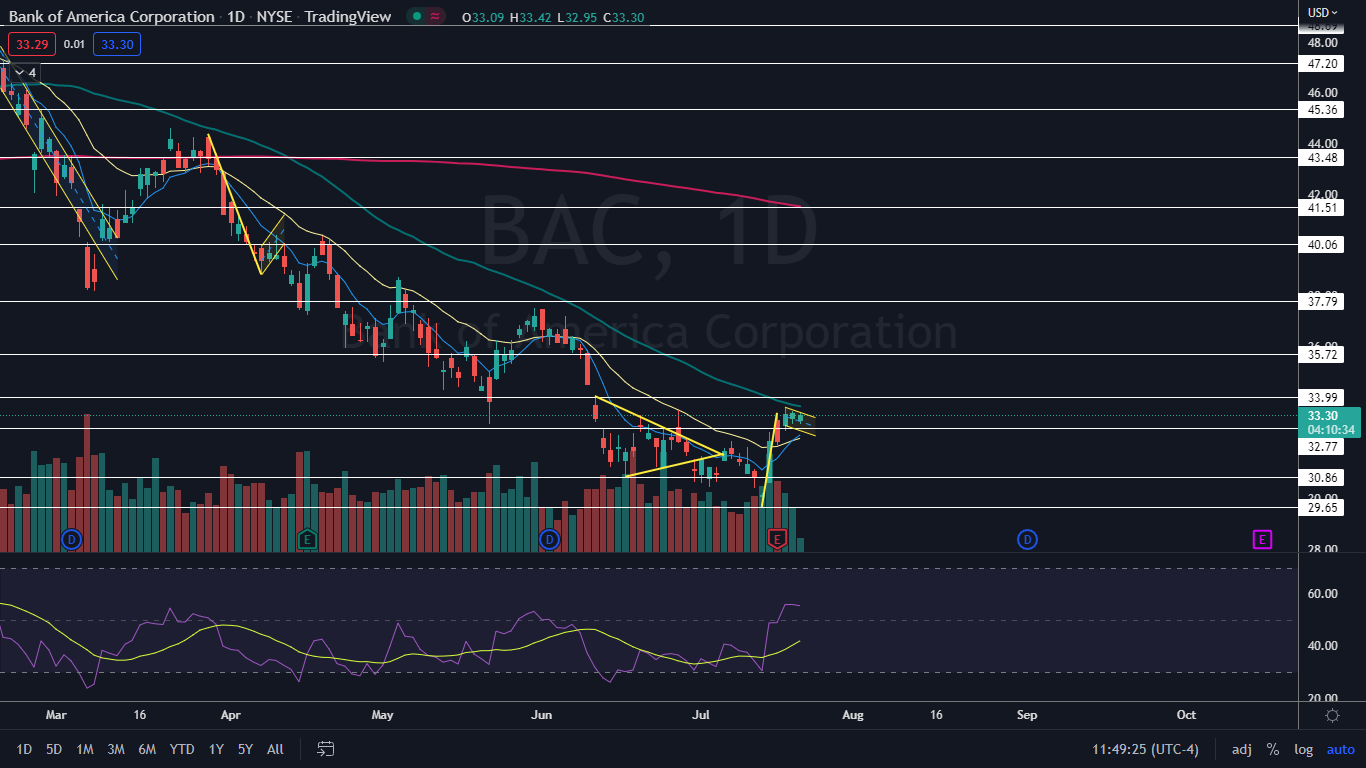
Photo: Tero Vesalainen via Shutterstock