
In the most recent quarter, Badger Meter Inc. (BMI) posted outstanding financial returns, with sales growth peaking at 26% and a record-setting Earnings Per Share (EPS). The company demonstrated notable growth, reflecting an 80 basis point hike in its operating margin and generating substantial cash flow, which has facilitated its capital allocation strategy, including increasing dividends.
BMI is witnessing remarkable expansion across its comprehensive assortment of digital smart water solutions. This growth is also supported by the gradual restoration of supply chain conditions, resulting in a surge in sales.
The positioning of the company promises massive potential for value creation in the future. Facilitated by a combination of robust order momentum, increased backlog, industry-leading technology, proven track record of execution, and favorable market dynamics, BMI's prospects look bright.
The company continues to gain traction, establishing a strong footing for profitable growth over an extended period.
“As we prepare to close out the year, we remain focused on execution and capitalizing on the strength of our end markets with anticipated strong sales and operating performance, yet with sequentially fewer total operating days as a result of holidays in the fourth quarter,” said Kenneth C. Bockhorst, Chairman, President and Chief Executive Officer.
Scheduled to release its earnings for the fourth quarter and full year 2023 before the market opens on January 26, 2024, BMI presents as a potentially lucrative investment opportunity now. Further insights can be garnered from an in-depth analysis of the company's key performance indicators.
Analyzing Financial Performance: A Comprehensive Review of Badger Meter Inc.'s Profitability and Growth Trends
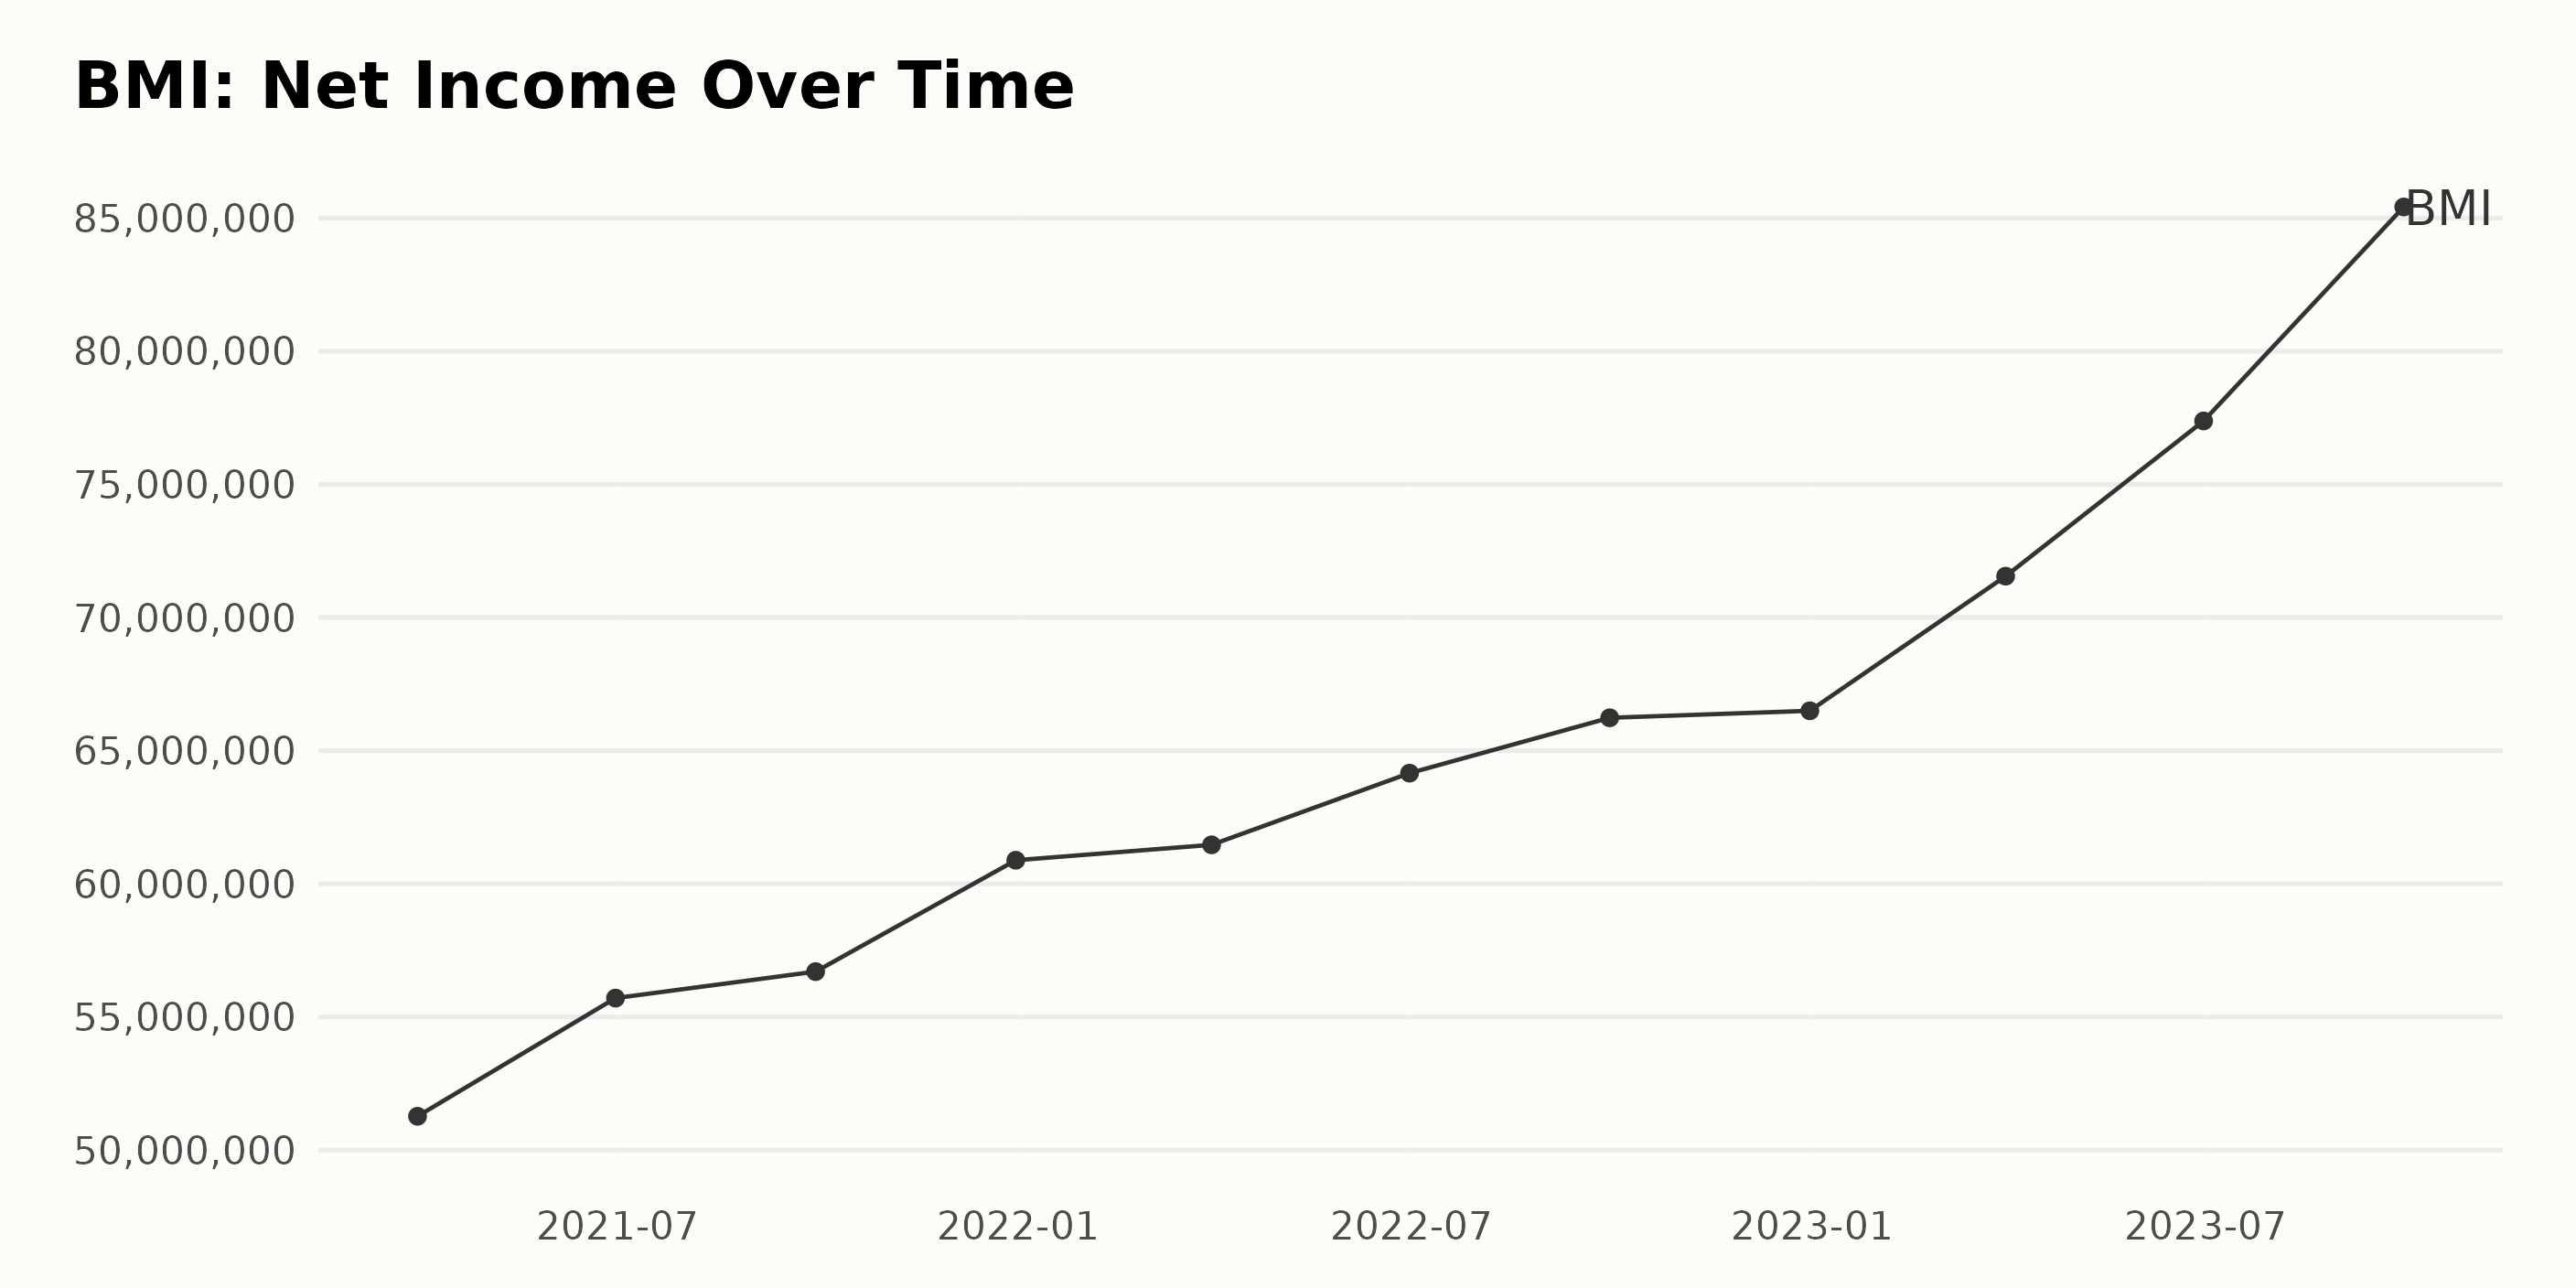
The trailing-12-month Net Income of BMI displayed a positive trend throughout the period, indicating increasing profitability.
- As of March 31, 2021, the company's net income stood at $51.27 million.
- In subsequent quarters, there were consistent increases, reaching $55.71 million by June 30, 2021, and $56.70 million by the end of September 2021.
- By the end of 2021, the Net Income rose to $60.88 million.
- Throughout 2022, the upward trend in net income continued, with Net Income reporting as $61.46 million on March 31, $64.16 million on June 30, $66.23 million on September 30, and peaking at $66.50 million by the end of the year.
- In 2023, Badger Meter, Inc.'s net income witnessed more significant growth, initiating with $71.55 million on March 31, climbing to $77.38 million by mid-year, and rising significantly to $85.42 million by September 30, 2023.
From March 2021 to September 2023, the company's net income therefore grew from $51.27 million to $85.42 million. This represents an impressive growth rate of approximately 66.64%. Overall, the data shows ongoing improvement in Badger Meter Inc.'s financial performance over the time series, with an accelerating uptick in more recent periods.
The trailing-12-month Revenue of BMI demonstrated an upward trend with some fluctuations over the time period from March 2021 to September 2023.
- On March 31, 2021, the revenue was $434.88 million.
- The revenue increased to $466.63 million by June 30, 2021, and further increased to $481.78 million by September 30, 2021.
- By the end of 2021 (December 31), the Revenue had risen to $505.20 million.
- In 2022, we saw a continued rise in Revenue with values of $519.76 million (March 31), $534.72 million (June 30), and $553.99 million (September 30).
- By December 31, 2022, the Revenue reached $565.57 million.
- The year 2023 showcased an increased growth rate with reported revenues of $592.27 million (March 31), $630.29 million (June 30), and by September 30, it reported an all-time high of $688.48 million.
With an initial value of $434.88 million on March 2021 and a final value of $688.48 million on September 2023, BMI demonstrated a growth rate of approximately 58.2% over the period under review. Even though there were minor fluctuations, the results significantly emphasized higher revenues in more recent data points, particularly towards the last recorded value in September 2023. The company shows a promising outlook based on these trends.

The Current Ratio of BMI has seen a generally upward trend over the time series from March 2021 to September 2023, with minor fluctuations. Key trends, fluctuations and growth rates are highlighted below:
- As of March 31, 2021, the Current Ratio stood at 2.84.
- This ratio saw a consistent upwards trend, peaking at 3.18 on December 31, 2021.
- A minor dip was noted in the ratio to 3.12 by June 2023, but it quickly recovered to 3.20 by September 2022.
- Thereafter, there were minor fluctuations between December 2022 and June 2023, with the ratio dipping to a low of 3.12 in March 2023 and rising to a high of 3.27 in June 2023.
- As of the most recent data point, September 30, 2023, the Current Ratio stood at 3.28.
In terms of growth rate, measuring the first value from March 2021 against the last from September 2023, the Current Ratio displayed an upward movement from 2.84 to 3.28, representing approximately a 15.5% increase over this period.

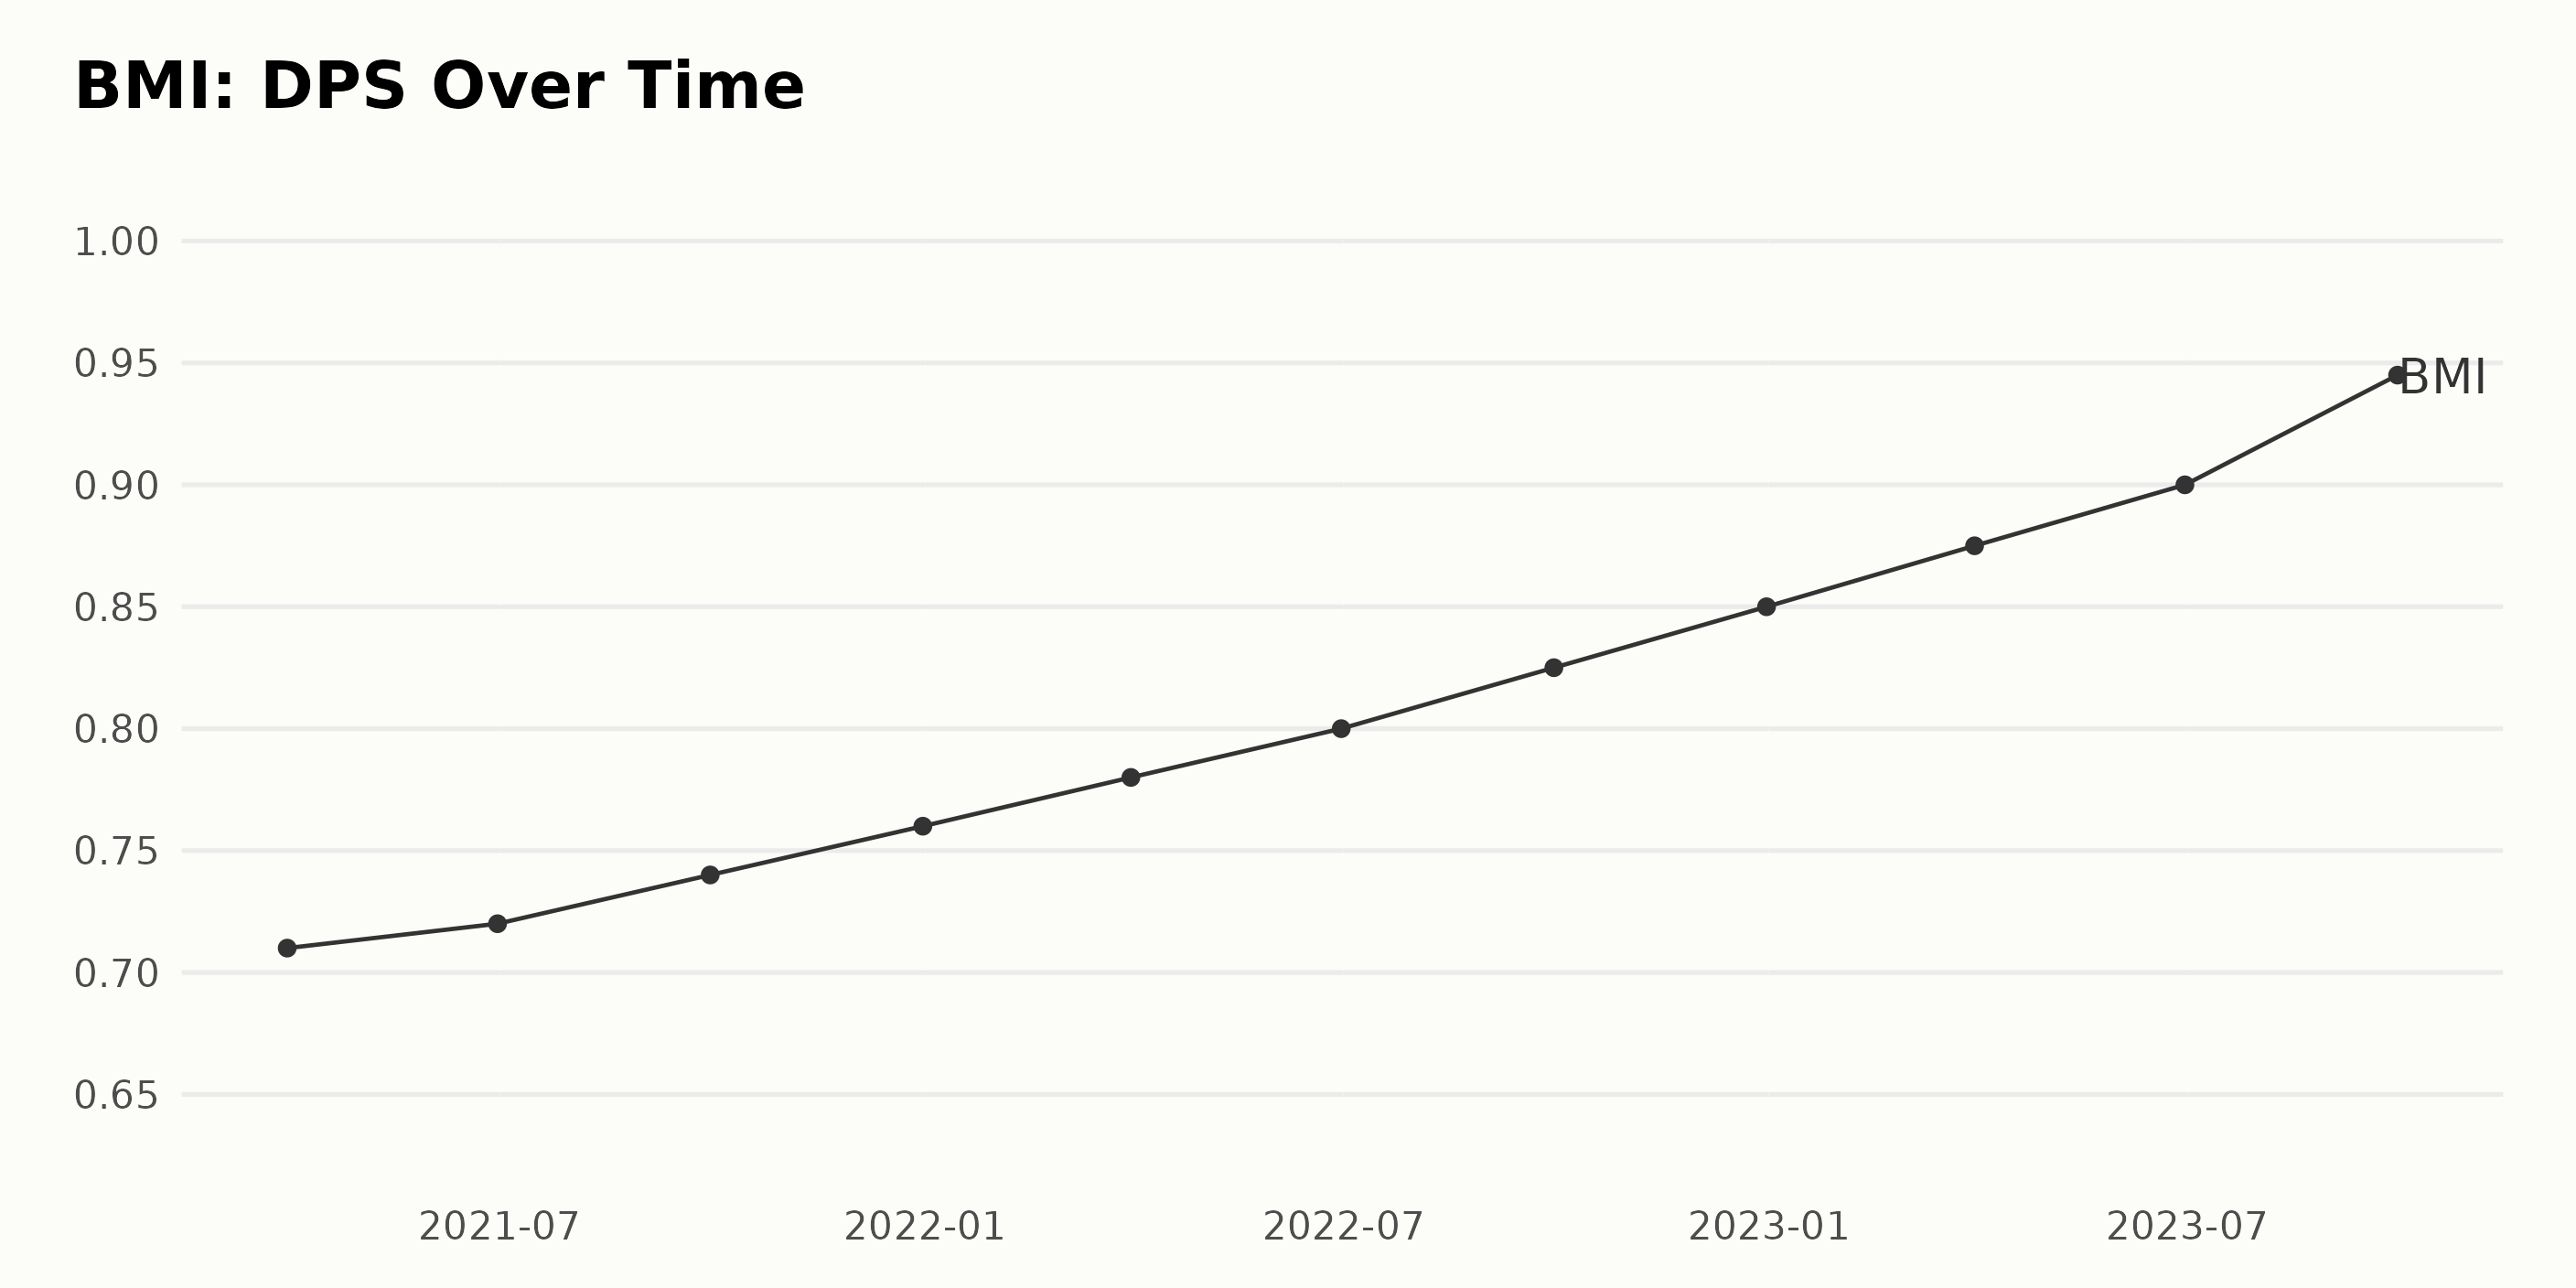
The DPS of BMI has seen a steady upward trend over the reviewed period from March 2021 to September 2023. The data shows a consistent expansion with minor fluctuations, suggesting strong financial performance and growth for the company.
- Starting at $0.71 in March 2021
- Gently increasing to $0.72 by June 2021, an increase of approximately 1.41%
- Reaching $0.74 by September 2021 and $0.76 by December the same year.
- The upward trend continued throughout 2022, hitting $0.78 in March, $0.80 in June, and then leaped to $0.825 in September, concluding the year at a healthy $0.85 in December.
- This growth persisted into 2023 as well, with the DPS registering at $0.875 in March, $0.90 in June and, a noticeable jump by September 2023 to $0.945.
Based on this current trajectory and taking into account the last value from the initial value, the growth rate measures at approximately 33.1% from March 2021 to September 2023. This indicates that BMI has succeeded in maintaining and boosting its shareholder returns over the review period. Please note that while the data exhibits minimal fluctuations, the general trend indicates a consistent increase in BMI's DPS, reflecting a positive outlook for the company's growth and profitability.
Fluctuating Trends in Badger Meter Inc. Share Prices from July 2023 to January 2024
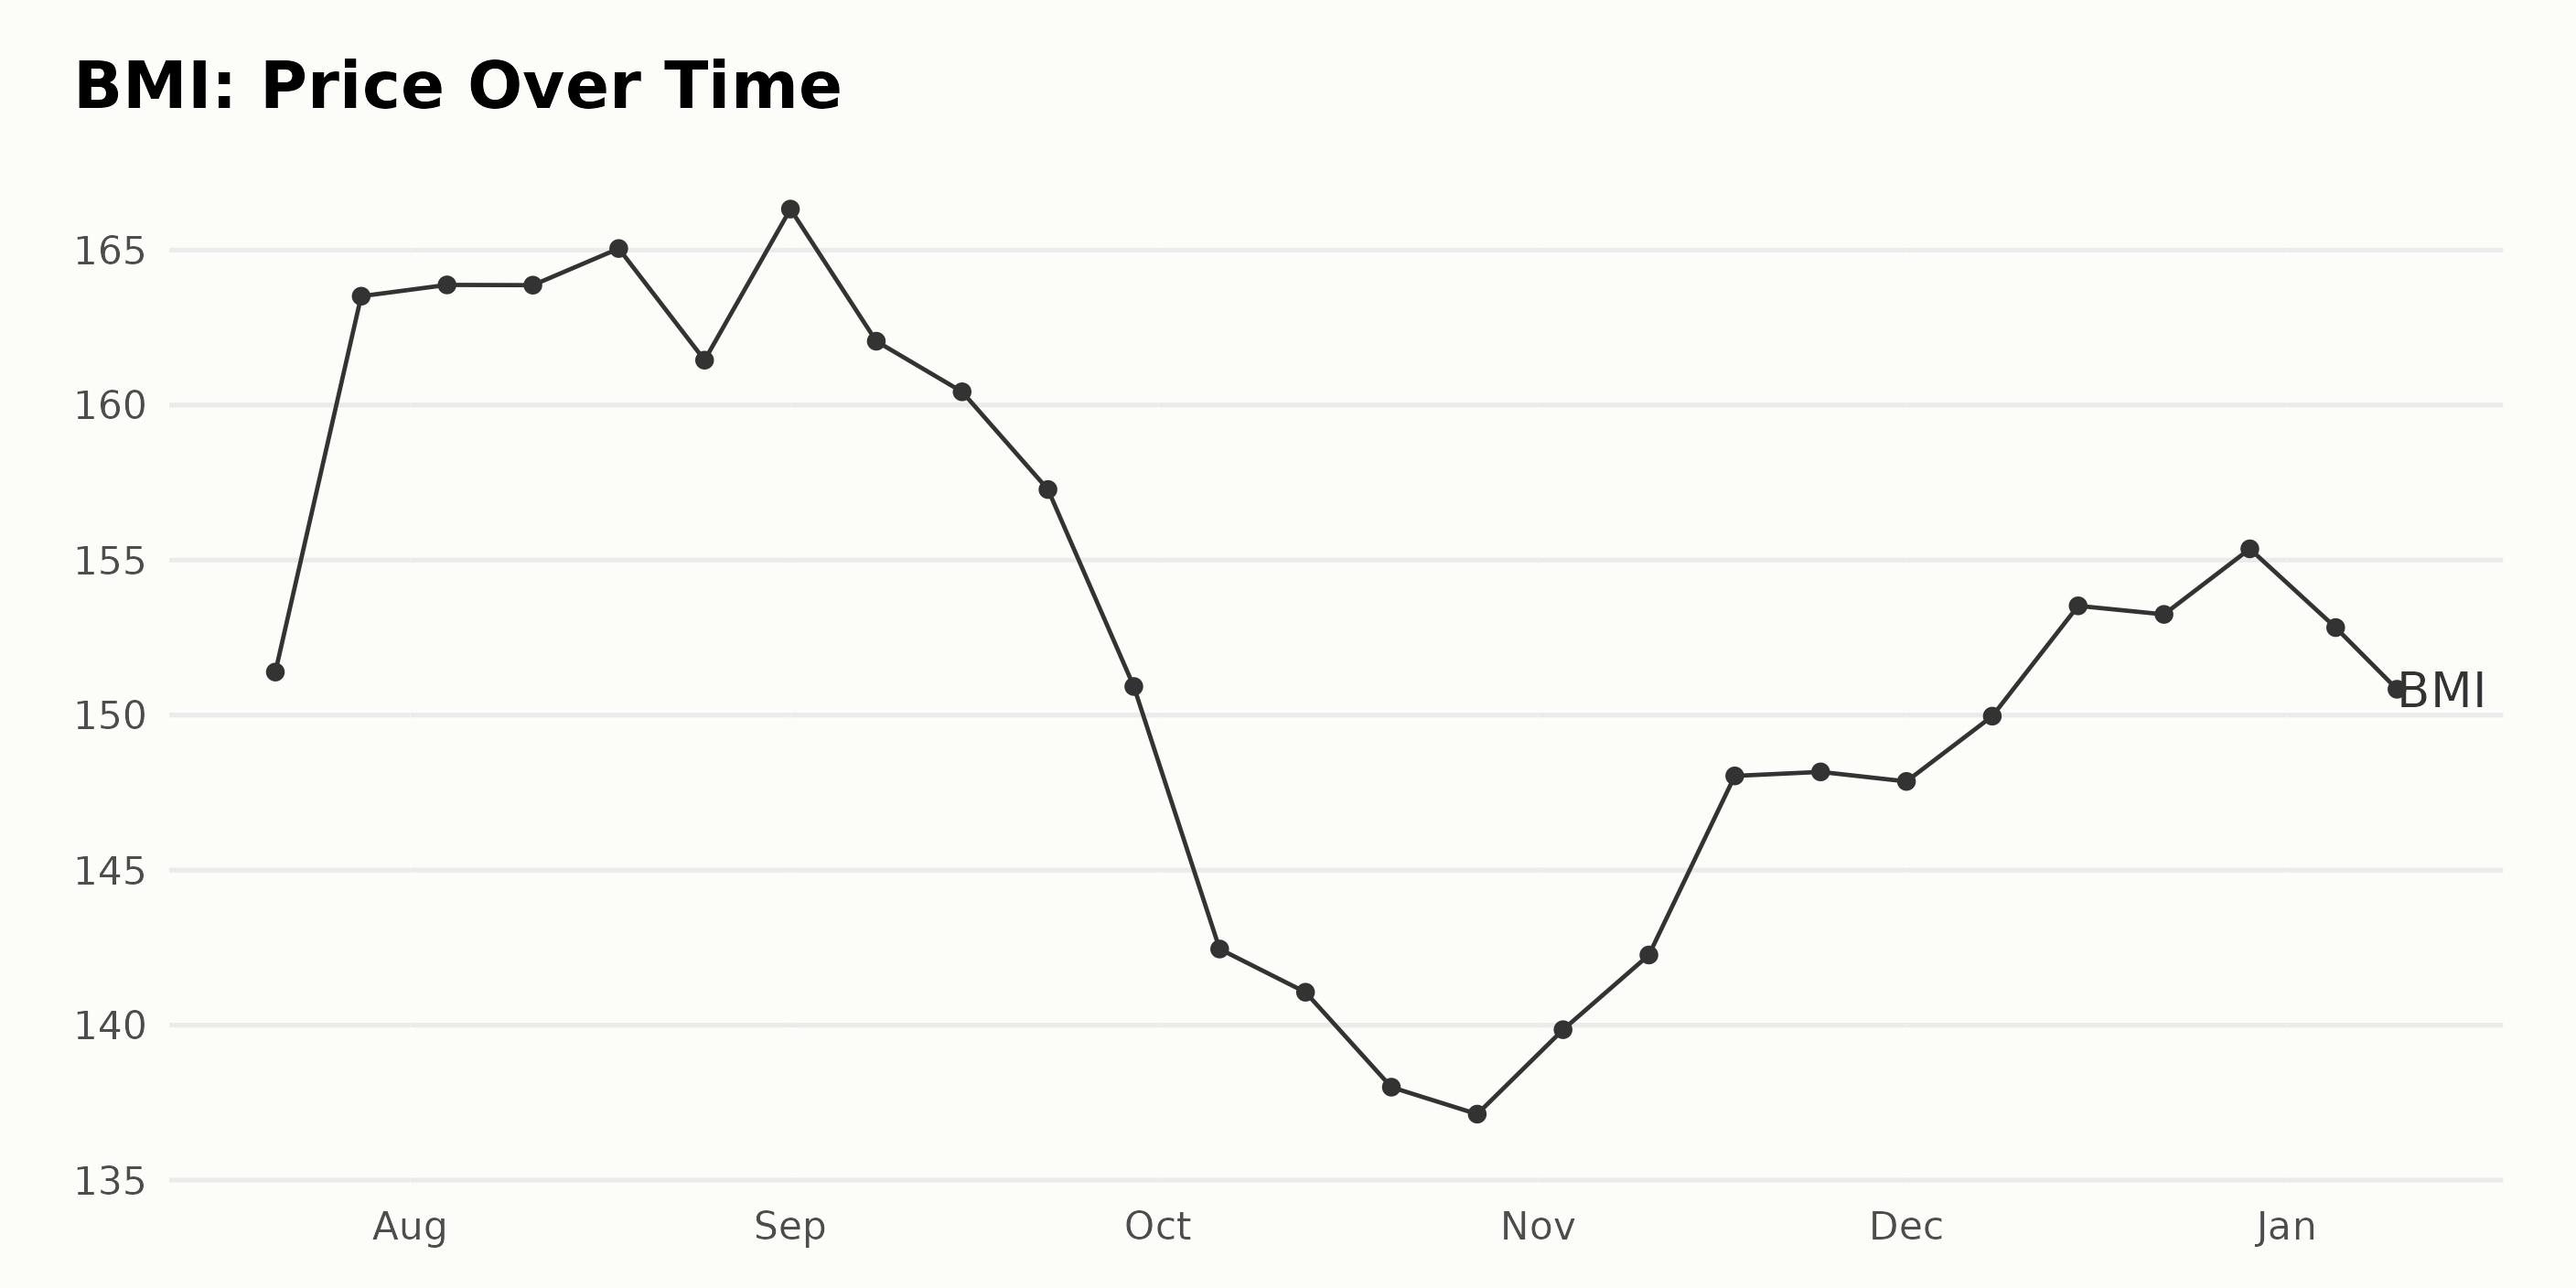
The Badger Meter Inc. (BMI) share prices have shown some fluctuations over the given period from July 21, 2023 to January 10, 2024:
July 2023: The price of BMI shares saw an increase from July 21 ($151.39) to July 28 ($163.51). This marks a growth rate of approximately 8.01%.
August 2023: Starting at $163.88 on August 4, the price made minimal changes until it peaked on August 18 at $165.05. However, it fell to $161.45 by the end of the month, resulting in an overall decrease of about 1.48%.
September 2023: There was a brief rise to $166.32 on September 1 but then the price continuously fell throughout September, dropping to $150.92 by September 29. This demonstrated a declining trend for this month with a decrease of approximately 9.26%.
October 2023: Throughout October, the BMI share prices continued to drop, starting at $142.45 and ending at $137.13. This represents a continuous downturn with a decrease of approximately 3.74%.
November 2023: Prices started to recover starting at $139.85 at the beginning of November and ending at $148.17 by the end of the month. That signifies an increasing trend with a growth rate of about 5.95%.
December 2023: The share price increased slightly during December, moving from $147.86 to $155.36 by month's end, displaying a modest growth trend of approximately 5.07%.
January 2024: In the first ten days of January, the prices experienced a decrease from $152.82 to $150.83, marking a slight decline rate of about 1.30%. Overall, there seems to be a trend of fluctuations in BMI's share prices: it rose during July and November, fell in August, September, October, and early January, and stayed somewhat stable in December. It peaked in early September and hit its lowest point in late October. The rate of change has been alternating between periods of moderate growth and decline. Here is a chart of BMI's price over the past 180 days.
Analyzing Badger Meter Inc.'s Quality, Momentum, and Growth Metrics in 2023-2024
BMI has an overall B rating, translating to a Buy in our POWR Ratings system. It is ranked #17 out of the 35 stocks in the Industrial - Manufacturing category.
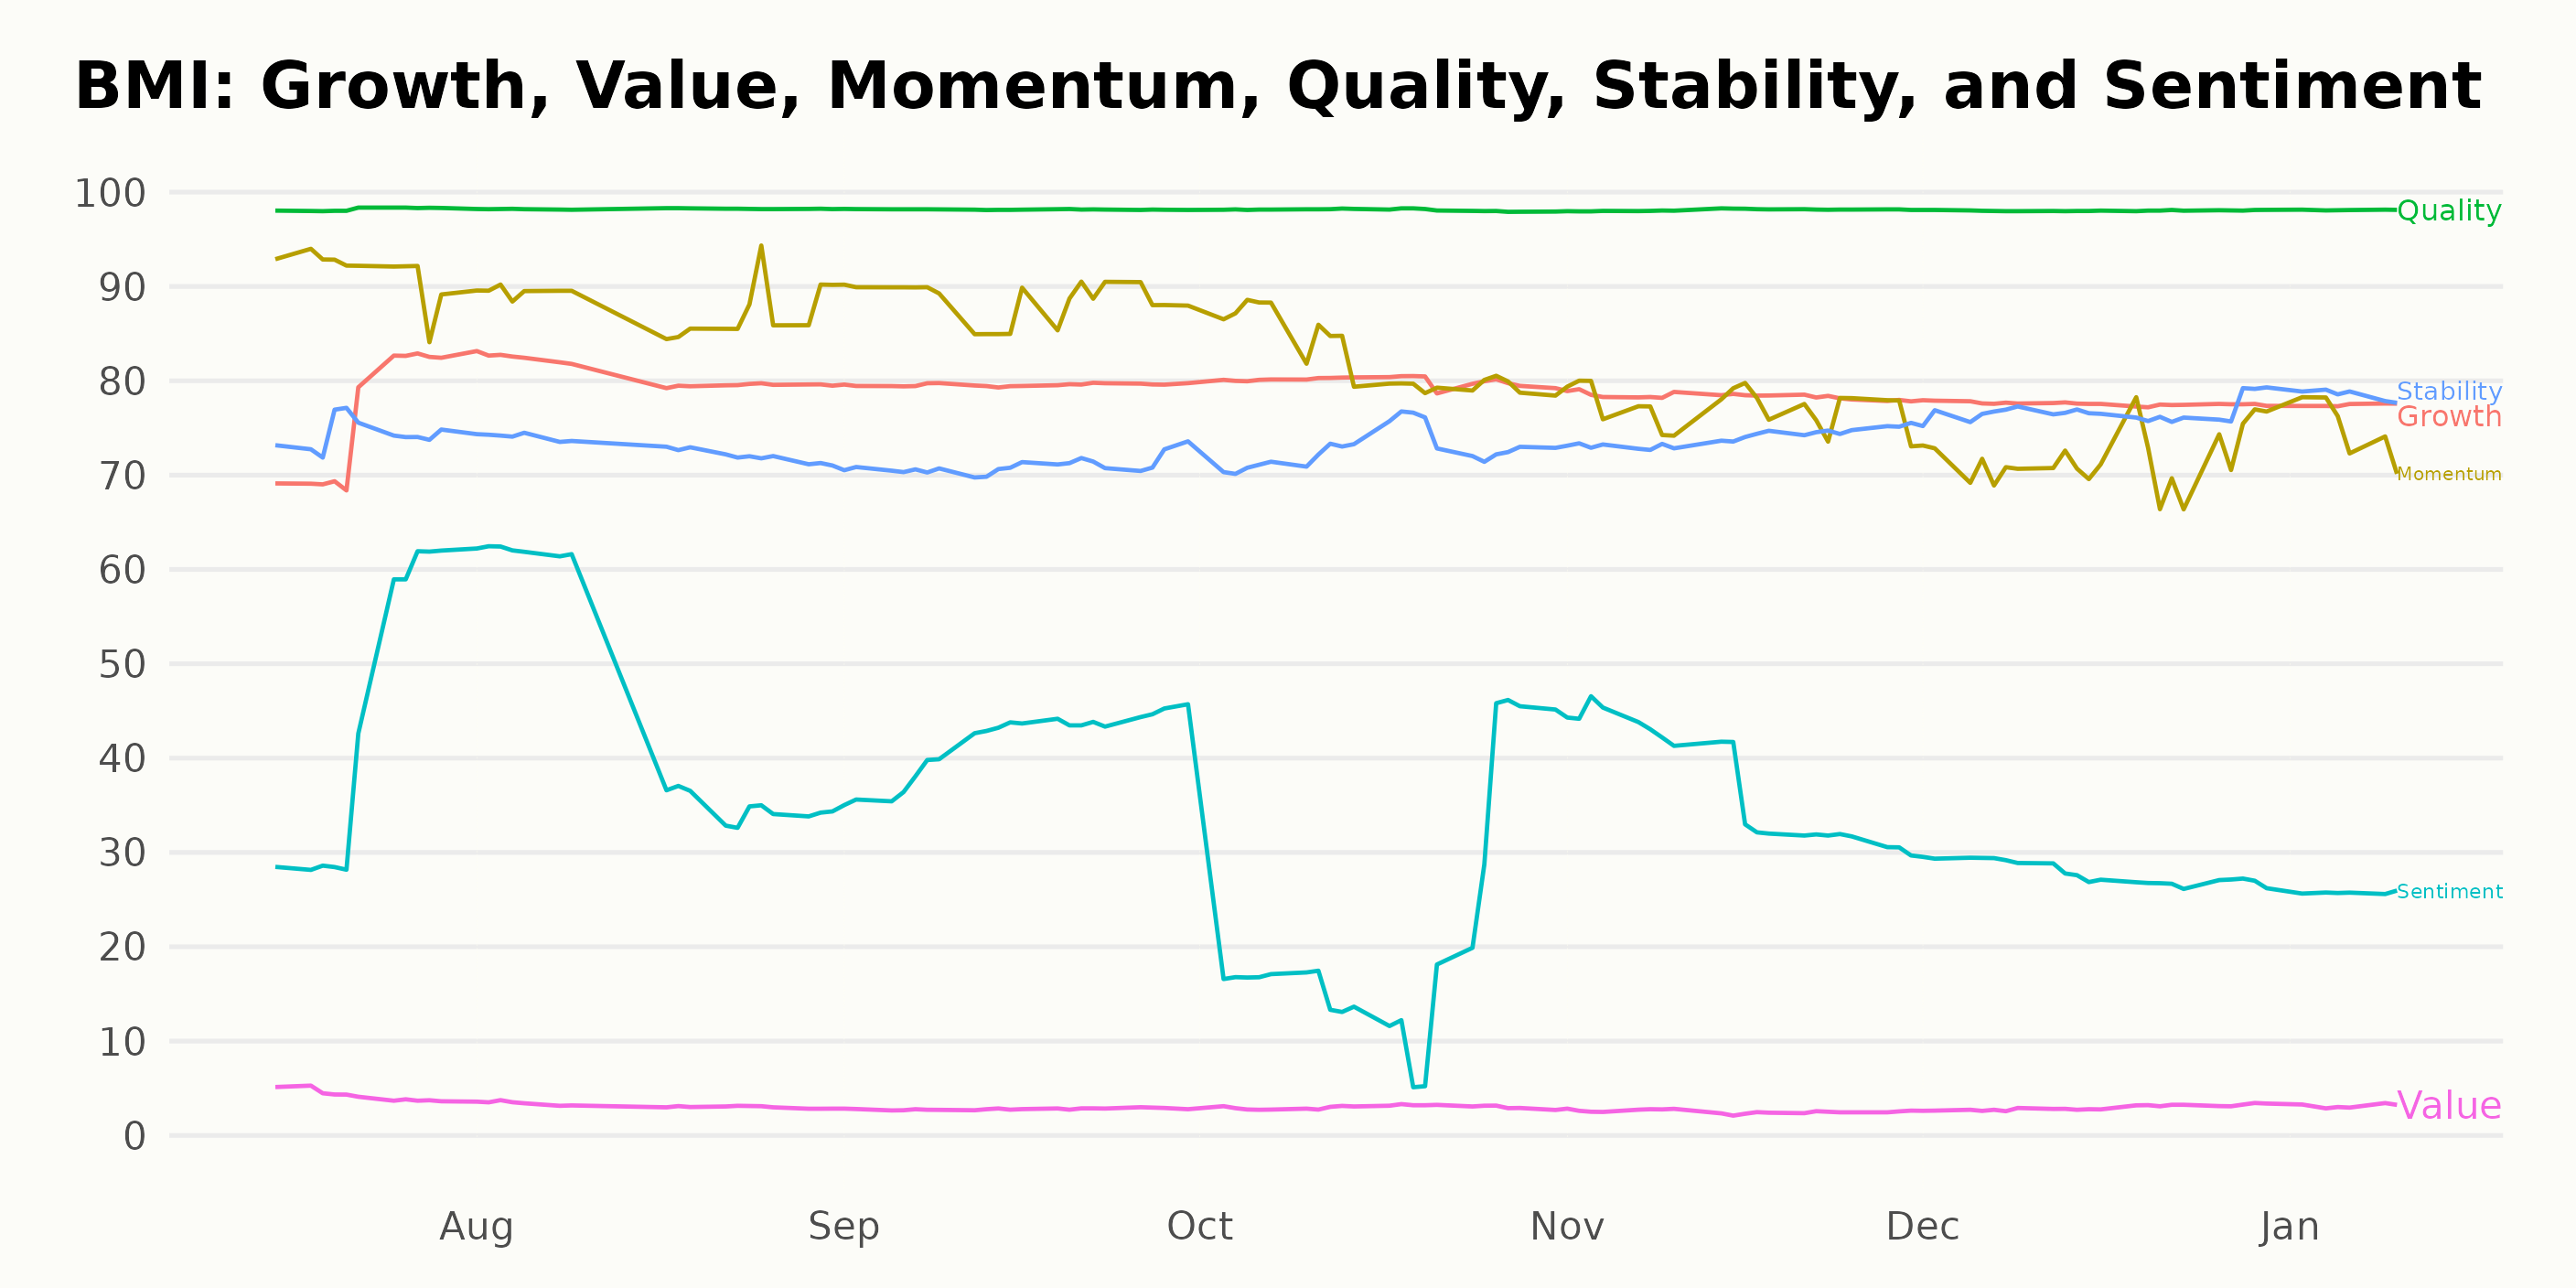
Badger Meter Inc. (BMI) displays distinct patterns across its three most influential dimensions - Quality, Momentum, and Growth of the POWR Ratings during the latter half of 2023 and early 2024.
- Quality: Maintaining a high value, the Quality dimension consistently scores at 98 across all months from July 2023 to January 10, 2024. This suggests that BMI exhibits strong reliability in terms of performance and operations.
- Momentum: The Momentum dimension begins at a peak score of 92 in July 2023. However, the subsequent months mark a steady decline, with values dropping to 88 in August 2023, sustaining this level until September 2023, decreasing further to 82 by October 2023, and hitting a low of 72 in December 2023. It then sees a modest increase to 75 by January 10, 2024. This trajectory might indicate a slowing positive momentum over time.
- Growth: The Growth dimension reveals moderate fluctuations. It starts with a rating of 76 in July 2023, rising to 81 by August 2023 before decrementing slightly to 80 between September and October 2023. The remainder of the period sees a gradual descent, with values reaching 78 in November, maintaining the same till December 2023, and then slightly dropping to 77 by January 10, 2024. This suggests an initially increasing but later declining growth trend.
These three dimensions collectively shed light on the overall performance and prospective direction for Badger Meter Inc. in this timeframe.
How does Badger Meter Inc. (BMI) Stack Up Against its Peers?
Other stocks in the Industrial - Manufacturing sector that may be worth considering are Siemens AG (SIEGY), CompX International Inc. (CIX), and Franklin Electric Co. Inc. (FELE) -- they have better POWR Ratings.
What To Do Next?
43 year investment veteran, Steve Reitmeister, has just released his 2024 market outlook along with trading plan and top 11 picks for the year ahead.
BMI shares were trading at $149.62 per share on Thursday afternoon, down $1.72 (-1.14%). Year-to-date, BMI has declined -3.08%, versus a 0.10% rise in the benchmark S&P 500 index during the same period.
About the Author: Subhasree Kar

Subhasree’s keen interest in financial instruments led her to pursue a career as an investment analyst. After earning a Master’s degree in Economics, she gained knowledge of equity research and portfolio management at Finlatics.
Is Badger Meter (BMI) the Dark Horse of 2024 Investments? StockNews.com