Get all your news in one place.
100’s of premium titles.
One app.
Start reading
Broadcasting & Cable
Business
Daniel Frankel

Infographic of The Week: Hub Entertainment Research Manages to Sum Up a Decade of Video Biz Change in a Single Chart

Watching tv.

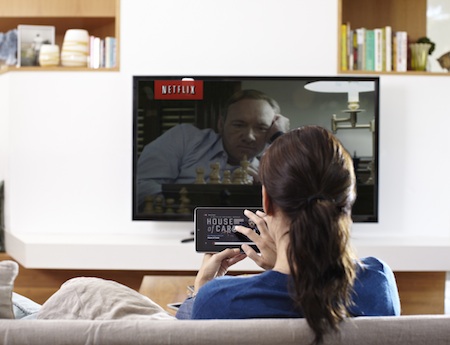
The average price of gasoline was $3.24. Marvel's Iron Man 3 was the No. 1 movie at the box office. One of the first made-for-streaming original series, House of Cards, debuted on Netflix. CBS' NCIS was TV's top scripted show. "Thrift Shop" from Macklemore & Ryan Lewis (featuring Wanz) was the No. 1 single. 

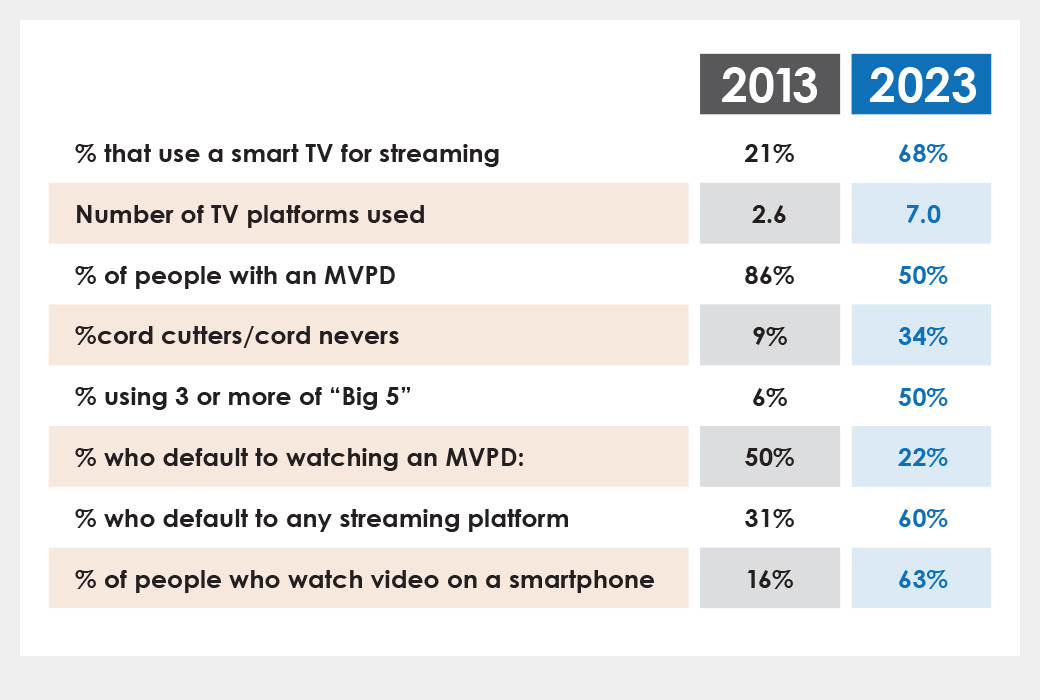
Eighty-six percent of Americans had pay TV at home, and only 21% of U.S. consumers used a smart TV to stream video. 

The year was 2013. And a lot of stuff has changed since then ... especially in the video business. Hub Entertainment Research, which was founded a decade ago, sums up the "then and now" quite nicely in this chart:

(Image credit: Hub Entertainment Research)
Sign up to read this article
Read news from 100’s of titles, curated specifically for you.
Already a member? Sign in here
Related Stories
Top stories on inkl right now
One subscription that gives you access to news from hundreds of sites
Already a member? Sign in here
Our Picks
Fourteen days free
Download the app
One app. One membership.
100+ trusted global sources.