Imagine how you would feel if your employer cut your pay by $6,800 a year.
You would probably immediately look for ways to cut back expenses, and you might find the choices difficult—maybe you can live without cable TV or eating at restaurants, but for some people, the choice may come down to eliminating essentials like health insurance, a car or even food.
In a way, you have had a pay cut—it’s called inflation, and as of June 10, 2022 you’ve taken an 8.6% hit to your dollars, or spending power. The U.S. Bureau of Labor Statistics reported that in May, the Consumer Price Index (a widely watched inflation indicator) rose 8.6% from the previous year, the largest 12-month increase since the period ending December 1981. Prices for food at home rose 11.9% over the year. Food, shelter and gas were the biggest contributors to inflation.
For a U.S. family earning the national median family income of $79,900, (2021) 8.6% is like an increase of $6,871 in expenses annually.
What does that look like? For the average household dedicating 33.1% of its budget to housing costs, $6,871 is more than three months rent. For a thrifty family spending $901.30 a month on food, $6,871 is 7.5 months of groceries. It’s an entire year of health insurance for a single 40-year old on a silver plan.
For those already stretched to their budget limit, staying afloat means taking on debt, which is also getting more expensive as interest rates rise.
A March Bankrate poll found that 93% of Americans have noticed higher prices this year, and price increases are most noticeable in food and energy. Bankrate parsed the June 2022 data from the Bureau of Labor Statistics, to come up how much prices have gone up for many of the common items we buy.
Read: This Is Why Your Bottle of Wine Just Got More Expensive
The good news? Wireless phone services have gone down an average of 0.70%, but that’s about it, and it’s hardly enough to offset the other price increases. Most foods have gone up, day care has gone up, rent, electricity, clothes and cable TV and other services cost a lot more.
This might be a good time to cut back on snacking: Potato chips now average about $5.62 for 16 ounces, cookies are $4.51 a pound and ice cream is $5.35 for a half gallon.
Here’s how much prices have gone up for 44 common items, including food, clothes, insurance and utilities, as of May 2022, according to Bankrate.

Girls’ apparel
Year-over-year increase: 0.5%

Prescription drugs
Year-over-year increase: 1.9%
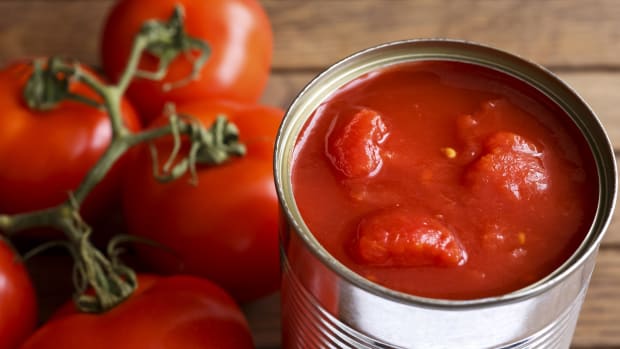
Tomatoes
Year-over-year increase: 2%
Shutterstock
Intracity mass transit
Year-over-year increase: 2%

Personal care products
Year-over-year increase: 2.8%

Nonprescription drugs
Year-over-year increase: 3.2%

Day care and preschool
Year-over-year increase: 3.2%

Medical care services
Year-over-year increase: 4%
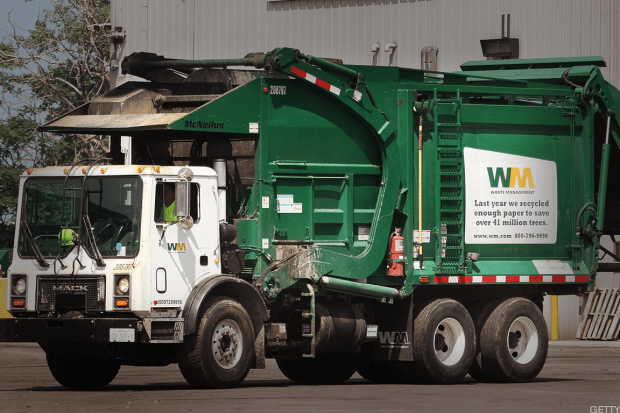
Water and sewer and trash collection services
Year-over-year increase: 4.4%
Getty

Motor vehicle insurance
Year-over-year increase: 4.5%
Joseph Sohm / Shutterstock

Women’s apparel
Year-over-year increase: 4.9%

Rent
Year-over-year increase: 5.2%
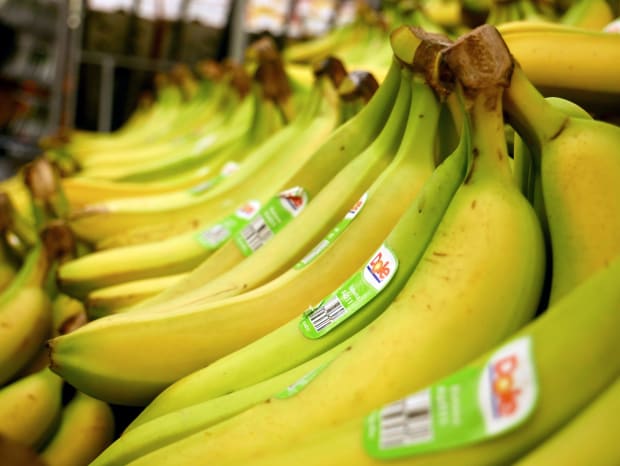
Bananas
Year-over-year increase: 5.6%
Bananas now average about 62 cents a pound.

Cable and satellite television service
Year-over-year increase: 5.8%

Boy’s apparel
Year-over-year increase: 5.9%
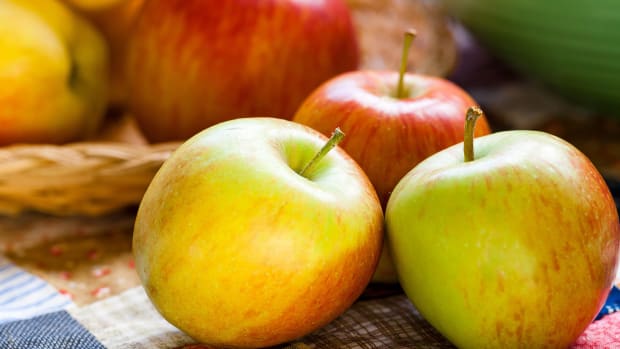
Apples
Year-over-year increase: 6.2%

Pet services, including veterinary
Year-over-year increase: 7.8%

Men's apparel
Year-over-year increase: 7.8%

Fruits and vegetables
Year-over-year increase: 8.2%

Pet products
Year-over-year increase: 8.3%
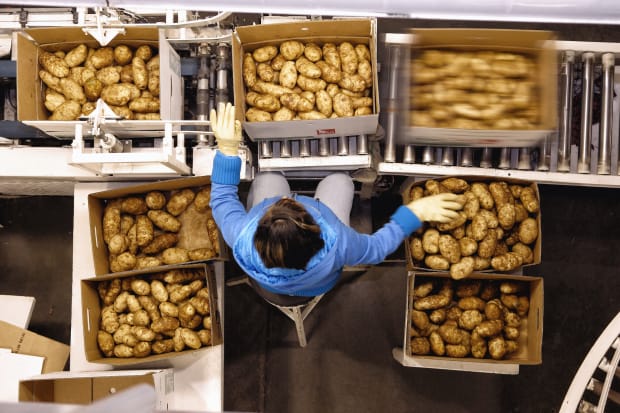
Potatoes
Year-over-year increase: 8.6%

Bread
Year-over-year increase: 8.7%
Shutterstock
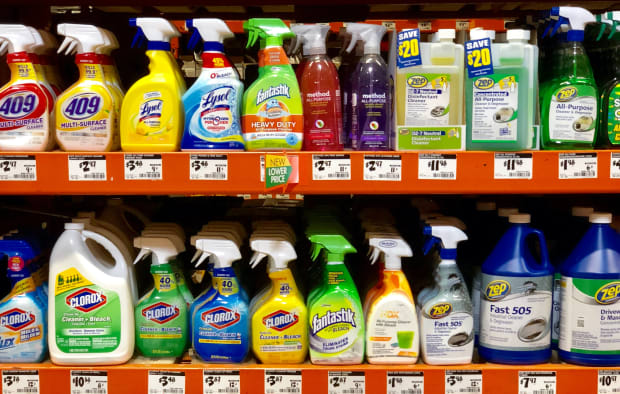
Housekeeping supplies
Year-over-year increase: 9.2%

Sugar
Year-over-year increase: 9.3%

Ice cream
Year-over-year increase: 9.6%
A half gallon of ice cream is running an average of $5.35.
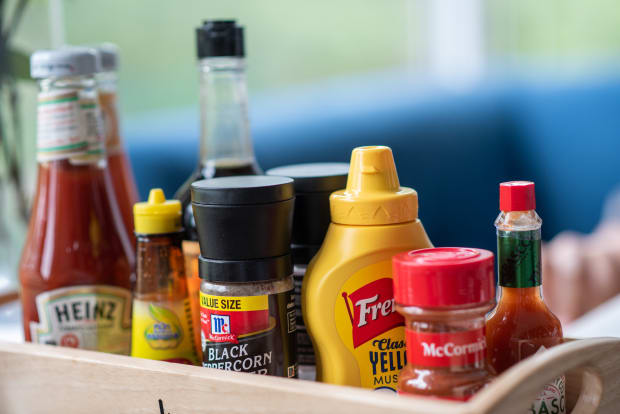
Spices, seasonings, condiments, sauces
Year-over-year increase: 10.1%

Infant and toddler apparel
Year-over-year increase: 10.2%
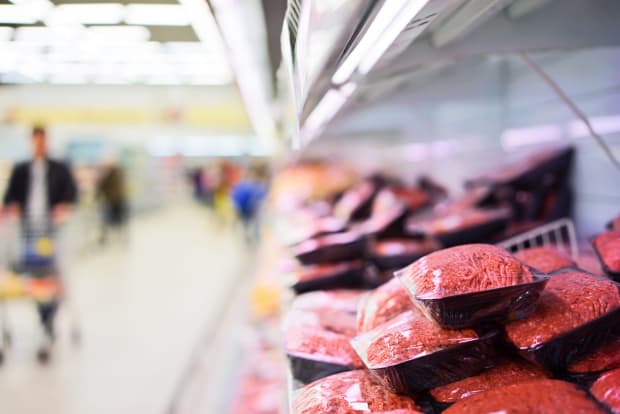
Beef and veal
Year-over-year increase: 10.2%
A pound of ground beef averages about $4.79 a pound.
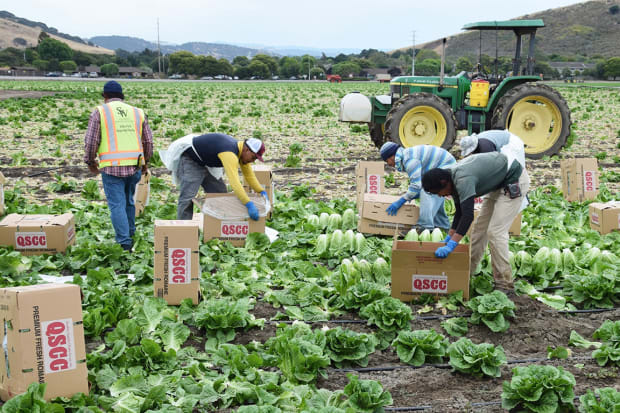
Lettuce
Year-over-year increase: 11.4%
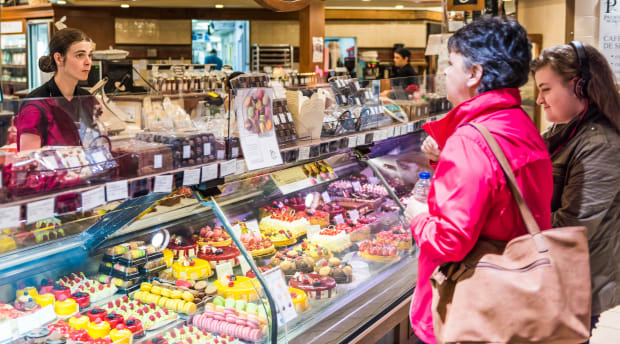
Cakes, cupcakes and cookies
Year-over-year increase: 11.8%
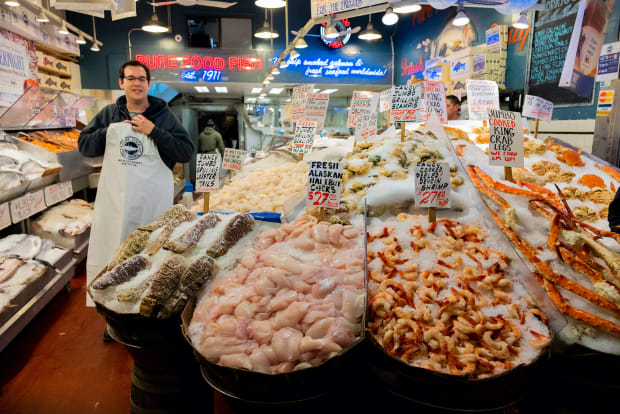
Fish and seafood
Year-over-year increase: 12%
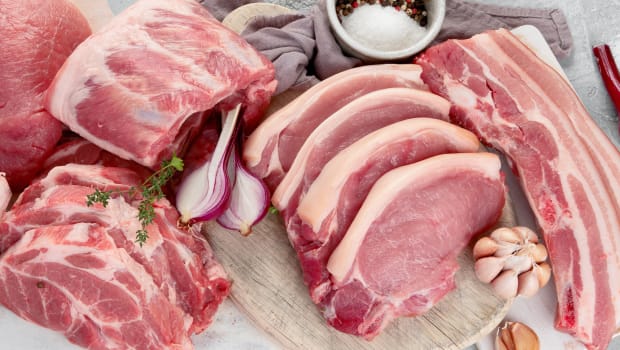
Pork
Year-over-year increase: 13.3%
Meats in general are up 12.30%. Bacon is averaging around $7.36 a pound.

Baby food
Year-over-year increase: 12.9%
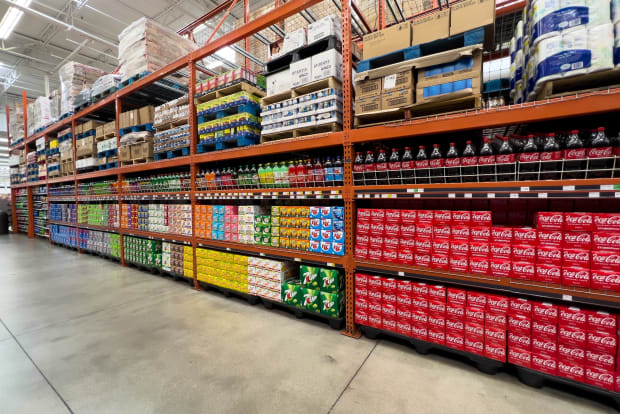
Carbonated drinks
Year-over-year increase: 13.2%
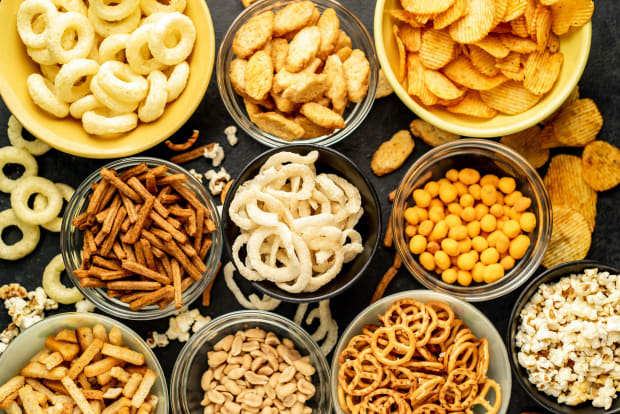
Snacks
Year-over-year increase: 13.6%

Health insurance
Year-over-year increase: 13.8%

Coffee
Year-over-year increase: 15.3%
The average cost of coffee is $5.84 a pound.
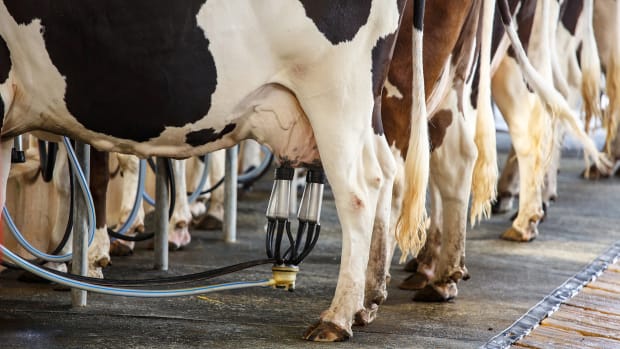
Milk
Year-over-year increase: 15.9%
The average cost of a gallon of milk is $4.20.
Shutterstock
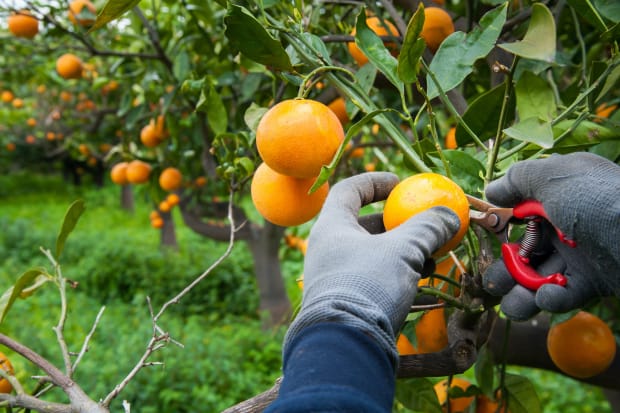
Citrus fruits
Year-over-year increase: 16.1%
Oranges are costing about $1.55 a pound.
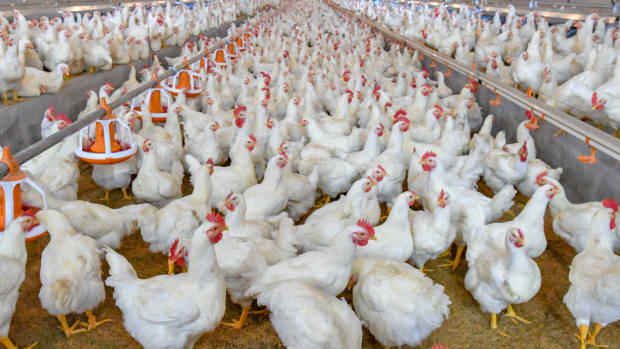
Chicken
Year-over-year increase: 17.4%
Chicken averages $1.82 a pound.

Utility (piped) gas service
Year-over-year increase: 20.2%

Butter and margarine
Year-over-year increase: 20.2%
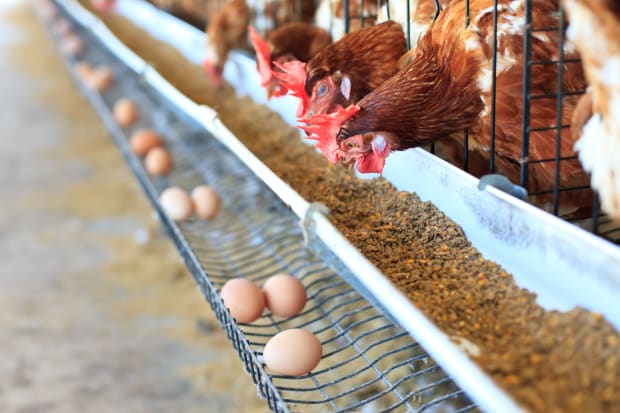
Eggs
Year-over-year increase: 32.2%
Eggs now cost an average of $2.86 a dozen.

Gasoline (unleaded regular)
Year-over-year increase: 49.5%
The price of crude oil is the primary reason for the spike in gas prices but there are other reasons as well, some of them being supply chain disruptions due to the pandemic, Russia's invasion of Ukraine, and U.S. sanctions.
To learn more about inflation and what causes it, read this explainer.
>> Read next: The Cars That Are Stolen the Most
>> and: The 30 Best Cities for Renters
Source: Bankrate, US Inflation Calculator