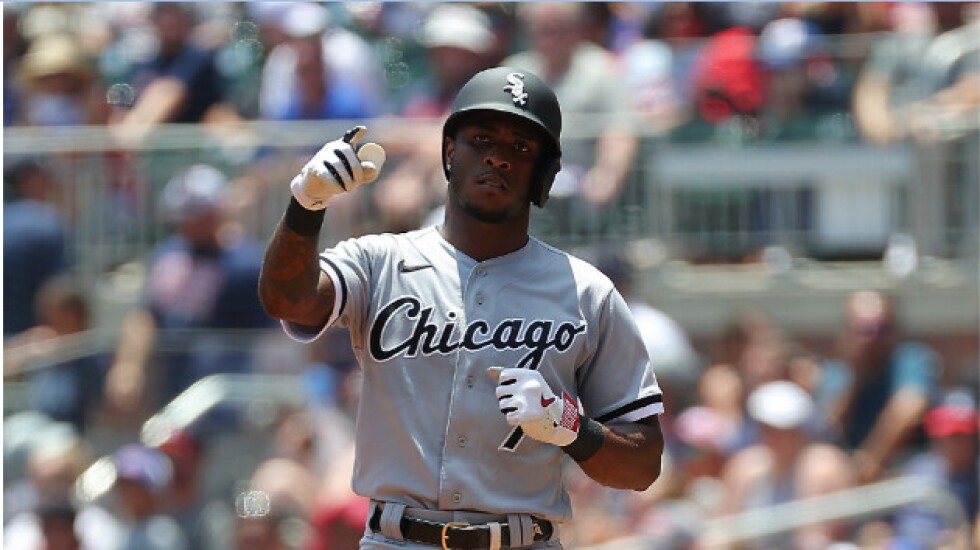
Very little has gone right this season for White Sox shortstop Tim Anderson.
Anderson’s traditional numbers are the weakest of his career. With walks in only 5% of his plate appearances and a power drop that has kept his extra bases to a minimum, most of Anderson’s offensive value is tied up in batting average, which stands at .227 after consecutive seasons of .335, .322, .309 and .301 starting in 2019.
Sometimes a dramatic drop in batting average is largely bad luck, a case of batted balls being just within, instead of just outside, fielders’ ranges. That can lead to an abnormally low batting average on balls in play. The usual pattern would be a return to a normal BABiP and increased production from that point on.
But the numbers behind Anderson’s numbers suggest more than bad luck. Along with a power outage, he has had an alarming increase in ground-ball percentage. His launch angle has dipped to nil.
In 214 plate appearances as a leadoff man, Anderson has only a .290 on-base percentage and a .585 OPS. The major-league averages for leadoff hitters are .337 and .762.
Since being dropped to No. 2 in the order, Anderson has 84 plate appearances and is hitting .167/.202/.192 for a .395 OPS. The major-league averages for No. 2 hitters are .260/.334/.437 for .771. Modern teams put one of their best hitters at No. 2, and their .771 OPS leads all lineup positions.
Anderson is hitting the ball about as hard as ever. His average exit velocity is 88.1 mph. Since his breakthrough season in 2019, Anderson has averaged 88.2, 87.2, 89.6 and 88.2 mph, according to Statcast data at MLB.com’s Baseball Savant section.
What has changed is Anderson’s launch angle. Starting in 2019, his averages were 8.7, 6.7, 4.3 and 3.3 degrees. All are below the major-league average of 12.2, but Anderson has plummeted to 0.2 degrees this season and is beating the ball into the ground.
He always has been a ground-ball hitter who relied on BABiP to keep his average up. Starting in 2019, his ground-ball percentages were 48.1, 56, 56 and 55.2. This season, he has tacked another 10% onto that and is at 65.5%.
With 3.1% barrels, Anderson is at the lowest point in his career. He peaked at 10.1% in 2020, followed by 7.8% and 5.8%.
Barrels combine exit velocity and launch angle to identify the balls most likely to go for extra-base hits. Anderson’s drop in launch angle and barrels has been accompanied by zero home runs in 2023. After 17, 20, 18, 10 (in the COVID-shortened 2020) and 17 homers since 2017, drops to six in 2022 and zero this season are worrying.
All together, Anderson is at minus-1.0 Fangraphs wins above replacement, which projects to about minus-1.8 for the season. Replacement-level production would lead to a .294 winning percentage. A replacement-level team would win about 48 games.
Anderson has been a good player for the Sox, but his struggles this season run so deep that his career could turn on rediscovering a stroke to cut down on grounders.