By learning to operate TD Ameritrade’s thinkorswim Trade Flash tool, you can hunt for blips of unusual option activity within your brokerage platform. Though Trade Flash won’t tell you how to trade the activity, it will show you some of the more unusual option activity that they’re seeing, which can help you to gauge sentiment.
Thinkorswim is great for gauging overall sentiment, but Trade Flash is a firehose of information, including some likely hedges against massive positions in the opposite direction. If you want a clearer, filtered-down picture of the most unusual option activity on the market (complete with weekly trade ideas and technical levels to enter & exit), you need Market Rebellion’s Unusual Option Activity Essential.
Still, being a successful option trader is about learning to use all of the knowledge, strategies, and tools at your disposal. We would be remiss not to include thinkorswim’s Trade Flash in that list of tools.
What Does Trade Flash by Thinkorswim Do?
Trade Flash is a simple, screenable tool that presents a scrolling feed of market information. Things like:
- Unusual Option Activity AKA “Big Delta Trades”: Option trades that fit certain criteria, like higher than usual volume, a trade that has a higher volume than the open interest, high-cost trades in far OTM or short-dated options, and more.
- Thinkorswim’s Trade Flash UOA scanner will show you whether a trade was a buy or a sell, the quantity of contracts bought or sold, the expiration date, the strike, the stock in question, the premium paid, and the total delta value of the trade as well.
- Colossal block trades on shares of individual stocks and even overnight futures, which can both be equally useful in helping market participants to gauge sentiment.
- Recent analyst upgrades and downgrades.
- Important news like earnings, halts, and more.
For traders who don’t want all of this information, or who want just a specific subset of the information (like unusual option activity), Trade Flash has a customizable filter through which users can hone in on specific data.
Ready to start trading? Try Unusual Option Activity Essential. Learn how you can follow the "smart money" with a fresh UOA trade idea each week - including technical levels so that you know where to enter and exit!

How to Use Thinkorswim’s Trade Flash
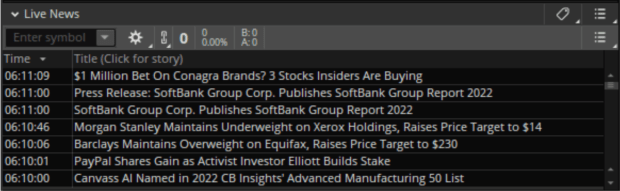
To access Trade Flash, look for the “Live News” gadget, which spawns in the top left corner of the platform by default. It looks like this:
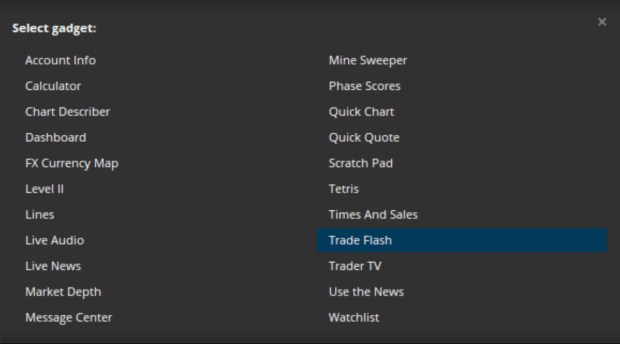
Then click on that little icon on the top right that looks like a little bulleted list, and click “switch gadget”. That’ll bring up the menu you see below, where Trade Flash is a clickable option.
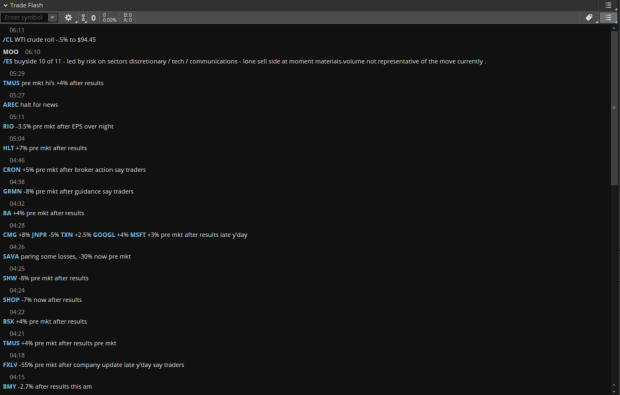
From here, you’ll see a panel that looks something like this:
Now that you have access to the Trade Flash tool, it’s time to filter down the results. You can do that by clicking the icon in the top right that looks like a price tag. That’ll bring up a menu like the one below.
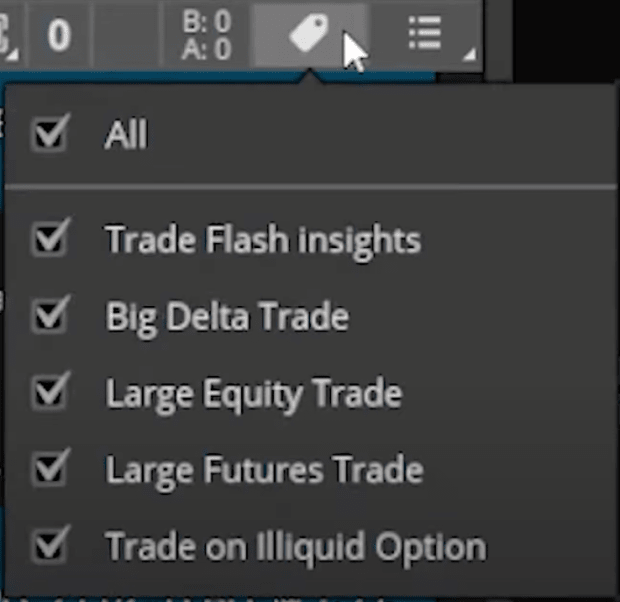
From here, you are offered give different filter options:
- Trade Flash Insights: This includes all of your standard market news — stock price movements, analyst price targets, earnings releases, and more.
- Big Delta Trade: This specifically targets option trades that buy or sell a higher-than-average amount of delta.
- Large Equity Trade: This includes all large block trades in shares of stock.
- Large Futures Trade: This includes large trades in the futures market.
- Trade on Illiquid Option: This includes large options trades on option chains that otherwise have very low volume.
You’ll also see a search bar in the top left of the Trade Flash tool. You can use that to hone in on specific stocks.
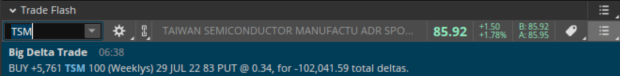
For instance, searching the ticker for Taiwan Semiconductor, and selecting only “big delta trades” brings up this alert - a large purchase of OTM weekly put options bought for $0.34 each, with a total negative delta of -102,041.59 (which means that a single dollar move lower in Taiwan Semiconductor will yield the buyer of these put options roughly $102,041.59 dollars).
The gear-shaped icon to the right of that search bar works the same, except with whole lists of stocks. You can use that to filter the data down to only stocks within your custom watch list, specific sectors, or even indexes like the S&P 500.
Take Everything With a Grain Salt
A great rule of thumb for anything trading related is to take every piece of information with a grain of salt. This purchase of TSM puts looks bearish, but this could be a downside hedge bought to protect a much larger bullish position. Or maybe this is a bearish trade from someone who is about to be wrong. There are just some things about this trade and the person (or institution) who made it that we will never know.
What we do know is that someone felt strongly enough about TSM’s short-term downside risk that they were willing to stake $195K on the possibility of the event happening. That isn’t insignificant. And if you started seeing more and more activity like this in the same name, that should start to pique your interest.
Digging Deeper Into Thinkorswim’s Daily Option Data
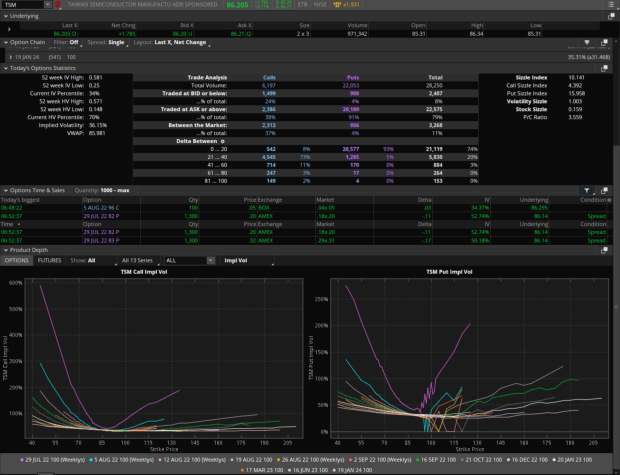
If you’re starting to get curious, there’s more data you can use to get an even clearer picture of the option activity in the name. To access it, click on the ticker and head to its option chain. That should bring up a list of the option expirations, as well as three tabs at the bottom that house information about option trading in the ticker on that day. Those tabs are called “Today’s Option Statistics”, “Options Time & Sales”, and “Product Depth”. When you expand those tabs, they should look something like this:
Here you can find a cornucopia of useful option data.
In the first section, “Today’s Options Statistics”, you’ll find metrics like:
- IV Percentile, which indicates how the current implied volatility of the option chain stacks up against itself historically.
- 52 Week IV High and Low
- Current IV
- VWAP or the volume weighted average price, which indicates the average price the stock has traded at throughout the day.
- The total number of calls and puts traded in the name, as well as the total option contracts traded in the name that day.
- Percentage of total contracts traded at or below the bid (often indicating a sale), and percentage of total contracts traded at or above the ask (often indicating a purchase).
- P/C Ratio, which indicates the ratio of puts to calls traded throughout the day.
- Sizzle Index, which compares the total number of contracts traded today against the five-day average.
A look at our example in TSM above shows that despite the stock price rising steadily throughout the day, option traders are trading more puts than calls at a ratio of more than 3.5. Put sizzle is at 15.958, which indicates that trading in put options is elevated, and as a whole the sizzle is at 10.14, which indicates that option trading as a whole is at a higher volume than usual today. We can also see that most options (79%) are being traded at or above the ask. If most of the options are puts, there are more being traded than usual, and they’re mostly being traded at the ask, that would typically indicate bearish sentiment, which we also saw in the “Big Delta Trade” in the same ticker above.
But there’s more that we can derive from this page of data. Looking at the tab titled “Options Time & Sales” will show you all of the option flow in the stock in question. You can use the filter icon in the top right of this tab (the one that looks like a funnel) to filter this huge amount of information. For instance, you can show only trades with a higher volume than 1,000.
For the sake of this example, here’s what that filter would look like in the name.
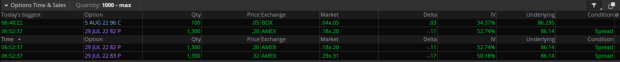
You can see two tabs: “Today’s Biggest”, which is exactly as it sounds - the largest option orders of the day by total price. And you can also see on the far right the “condition”, which essentially indicates what option strategy if any was used in conjunction with the purchase, such as whether it was a spread.
Getting a little nuanced, you’ll often see spreads in the “Big Delta Trade” alerts within the Trade Flash gadget. It won’t say, “spread purchase in $XYZ” - instead, you’ll see something like this:
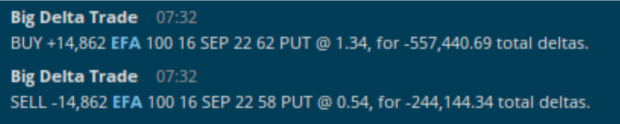
In the “Big Delta Trade” alert above, two option trades are made at the exact same time in the same ticker, with the same trade quantity. That tells us that these were two separate option legs in the same option strategy. The spread above looks like a bearish put debit spread at the $62 and sold at the $58 strike.
Lastly, the bottom tab labeled “Product Depth” shows a real-time graph of the call and put IV that day in various expirations and at various strikes.
The Bottom Line: Knowledge is Power. We know, it’s cliche. But it’s true. The more you know about options, sentiment, and news - the clearer a picture you’ll be able to see of the market's action, and the better a trader you’ll become.
Discover how Market Rebellion uses the power of unusual option activity to follow the “smart money” and learn how you can conquer any market like a pro. Check out our Insider’s Guide to Trading UOA.