Starbucks Corporation (NASDAQ:SBUX) shot up briefly intraday before retracing under Monday’s low-of-day to head into its third-quarter financial results Tuesday afternoon.
When Starbucks printed a second-quarter earnings beat on May 3, the stock gapped up 6.7% higher the following day and rallied almost 3% intraday. Starbucks then sold off heavily over the six trading days that followed before reversing into an uptrend at the $68.39 level on May 12.
For the second quarter, Starbucks reported revenue of $7.64 billion, which beat the $7.6-billion consensus estimate. The company reported earnings per share of 59 cents, which was in line with the consensus estimate.
For the third quarter, analysts, on average, estimate Starbucks will report earnings per share of 75 cents on revenues of $8.1 billion.
The most recent analyst to weigh in on Starbucks was Morgan Stanley analyst John Glass, who maintained an Equal-Weight rating on the stock and raised the price target from $87 to $88.
Traders and investors will be watching Starbucks closely to see whether soaring inflation and a series of interest rate hikes have caused consumers to spend less at the coffee chain.
From a technical analysis perspective, Starbuck’s stock looks bullish heading into the event, having settled into a consistent uptrend pattern on the daily chart.
It should be noted that holding stocks or options over an earnings print is akin to gambling because stocks can react bullishly to an earnings miss and bearishly to an earnings beat.
See Also: Signs That Traders Expect Starbucks Shares To Cool Off After Earnings
The Starbucks Chart: Starbucks began trading in its most recent uptrend on June 16 after bouncing up off the $70.35 level. The most recent higher low within the trend was printed on July 26 at $80 and the most recent higher high was formed at the $85.59 mark on Monday.
- The retracement taking place on Tuesday is needed to cool Starbuck’s relative strength index (RSI), which on Monday reached over 66%. When a stock’s RSI nears or reaches the 70% level, it becomes overbought, which can be a sell signal for technical traders.
- If Starbucks closes Tuesday’s trading session near its low-of-day price, the stock will print a bearish shooting star candlestick, which could indicate lower prices will come again on Wednesday. If the stock is able to rise up to close the trading day near to its opening price, Starbucks will print a doji candlestick, which could indicate the next higher low has occurred.
- Starbucks has resistance above at $86.61 and $91.12 and support below at $82.37 and $79.18.
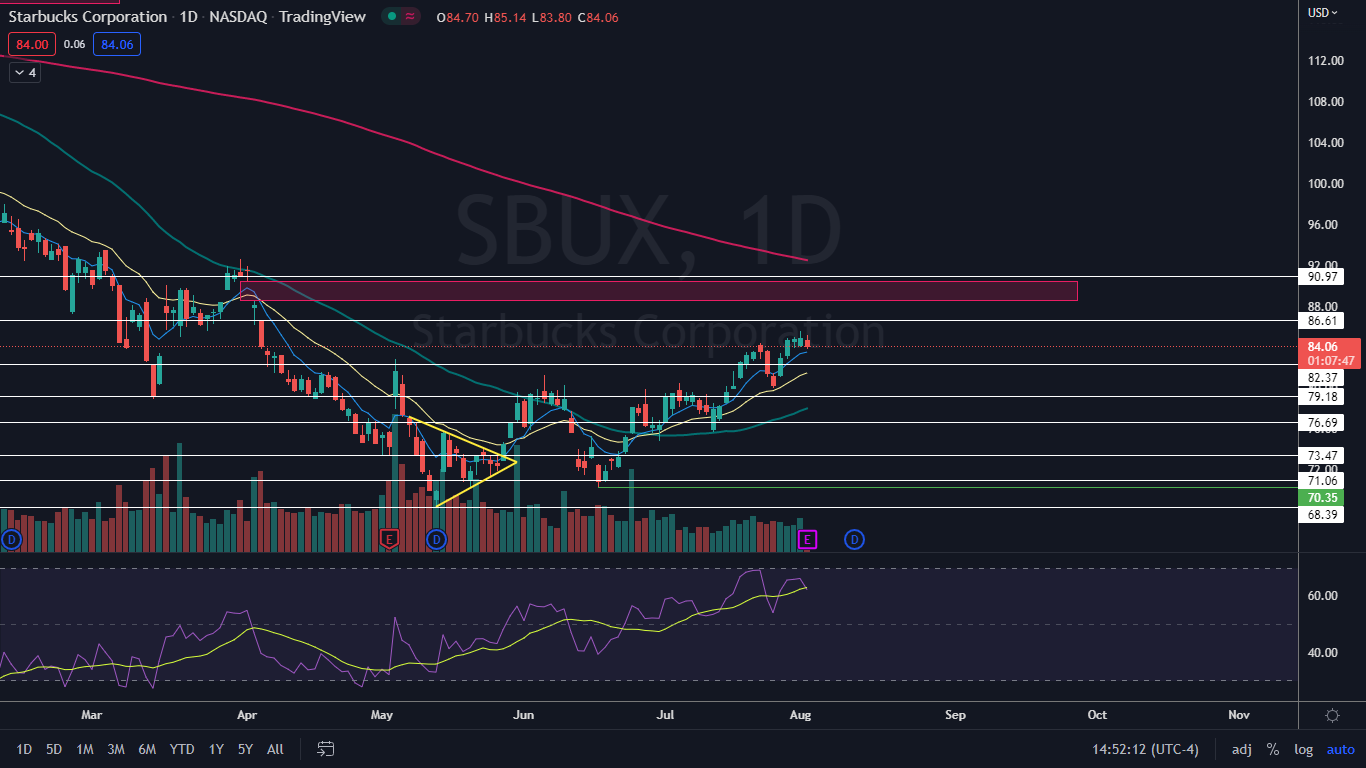
Photo via Shutterstock.