Home Depot (NYSE:HD) on Tuesday announced that sales were up 11% in the fiscal fourth-quarter, as the retailer beat analysts' expectations and said it sees sales growth ahead for 2022. Shares were up 1.44% in pre-market trading.
When the company reported its third-quarter earnings on Nov. 17, the stock gapped up 2.13% the following day and went on to reach a new all-time high of $420.61 just 13 trading days later on Dec. 6.
For the third-quarter, Home Depot reported earnings per share of $3.18 compared to the consensus estimate of $3.05 and revenue of $33.53 billion, which beat the estimate of $32.04 billion.
The pandemic brought on a spending boom for Home Depot and other home improvement retailers as consumers began to use their time updating their homes and properties during lockdowns. The steep rise in home prices has also lessened the amount of homes for sale on the market, which has prompted homeowners to update their current properties as opposed to moving.
From a technical analysis perspective, Home Depot's stock looks set to climb higher, but it should be noted that holding stocks or options over an earnings print is akin to gambling because stocks can react bullishly to an earnings miss and bearishly to an earnings beat. Options traders, particularly those who are holding close dated calls or puts, take on extra risk because the intuitions writing the options increase premiums to account for implied volatility.
See Also: CNBC's Final Trades: AbbVie, Home Depot, Cisco Systems And This Undervalued Tech Major
The Home Depot Chart: Since reaching its all-time high, Home Depot has fallen 18% lower to the $344 mark, but is showing indications the bottom may be in.
- On Friday, Home Depot wicked from the $344.10 mark and paired with the price action on Jan. 24 at that level, the stock has now printed a bullish double bottom pattern on the daily chart.
- If the pattern is recognized, bullish traders can watch for big bullish volume to come in and push Home Depot up above the eight-day and 21-day exponential moving averages.
- If that were to happen, Home Depot would also break up through the upper descending trendline of a falling channel pattern. The falling channel pattern is considered bearish, but when a stock breaks up from the formation, it is a powerful reversal signal.
- Home Depot has a gap above between the $382.01 and $385.86. Gaps on charts fill about 90% of the time, so it’s likely the stock will trade up to fill the range in the future.
- Bearish traders want to see Home Depot fall below the $344 level, which will negate the double bottom pattern and indicate the downtrend is still intact.
- Home Depot has resistance above at $354.80 and $364.94 and support below at $343.61 and $335.23.
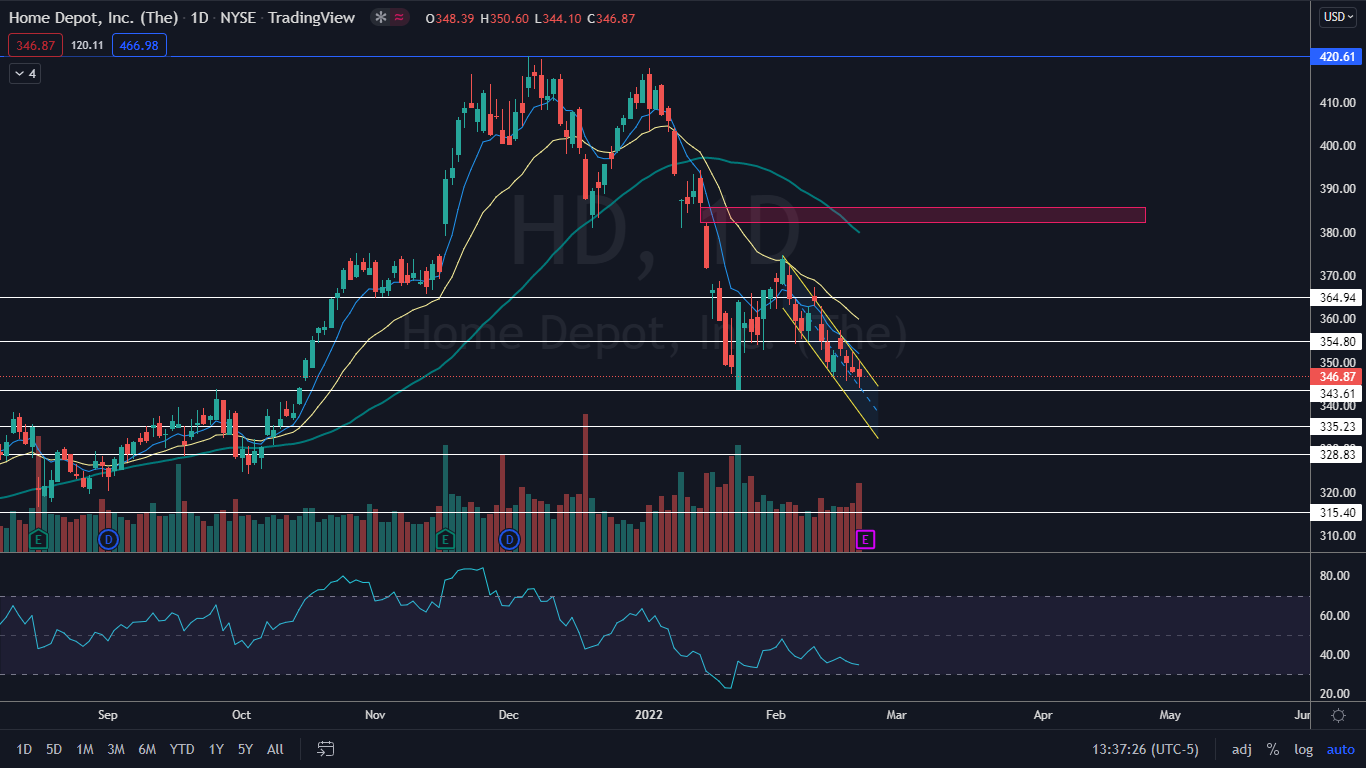
Photo: Courtesy of Mike Mozart on Flickr