
Chewy, Inc (NYSE:CHWY) is set to print its second-quarter financial results after the market close Tuesday. The recently beaten-down stock was trading about 2.2% lower heading into the event within a solid downtrend.
When the pet products retailer printed its first-quarter results on July 1, the stock was trading in a steep downtrend, but a positive reaction to the earning beat caused the stock to reverse course into a 2 1/2-month uptrend that ended Aug. 16.
For the first quarter, Chewy reported EPS of 4 cents on revenue of $2.428 billion. Both numbers topped consensus analyst estimates of a 13-cent loss and $2.42 billion, respectively.
For the second quarter, analysts expect Chewy to report a loss of 11 cents per share on revenues of $2.48 billion.
Ahead of the event, Barclays analyst Trevor Young maintained an Equal-Weight rating on Chewy on Monday and raised the price target from $28 to $30.
From a technical analysis standpoint, Chewy’s stock looks set to bounce in the near term — and head lower over the longer-term.
It should be noted that holding stocks or options over an earnings print is akin to gambling because stocks can react bullishly to an earnings miss and bearishly to an earnings beat.
Options traders, particularly those who are holding close dated calls or puts, take on extra risk because the intuitions writing the options increase premiums to account for implied volatility.
Want direct analysis? Find me in the BZ Pro lounge! Click here for a free trial.
The Chewy Chart: Chewy started trading in a downtrend on Aug. 16 and has since made a consistent series of lower highs and lower lows, printing 10 red candlesticks in a row.
The stock’s most recent lower high was formed on Aug. 23 at $43.33 and the most recent confirmed lower low was printed at the $41.09 level the day prior.
- Ten days of consecutive bear pressure has caused Chewy’s relative strength index (RSI) to measure in at about 35%. When a stock’s RSI near or reaches the 30% level, it becomes oversold, which can be a buy signal for technical traders and because of this, Chewy is likely to bounce over the coming days.
- If Chewy does bounce higher over the near-term, the stock could print a bearish head and shoulder pattern on the daily chart, with the left shoulder formed between July 1 and July 28, the head between July 29 and Tuesday and the right shoulder forming in the future if the stock creates an arc-shaped bounce.
- Chewy has resistance above at $44.15 and $50.30 and support below at $36.69 and $29.06.
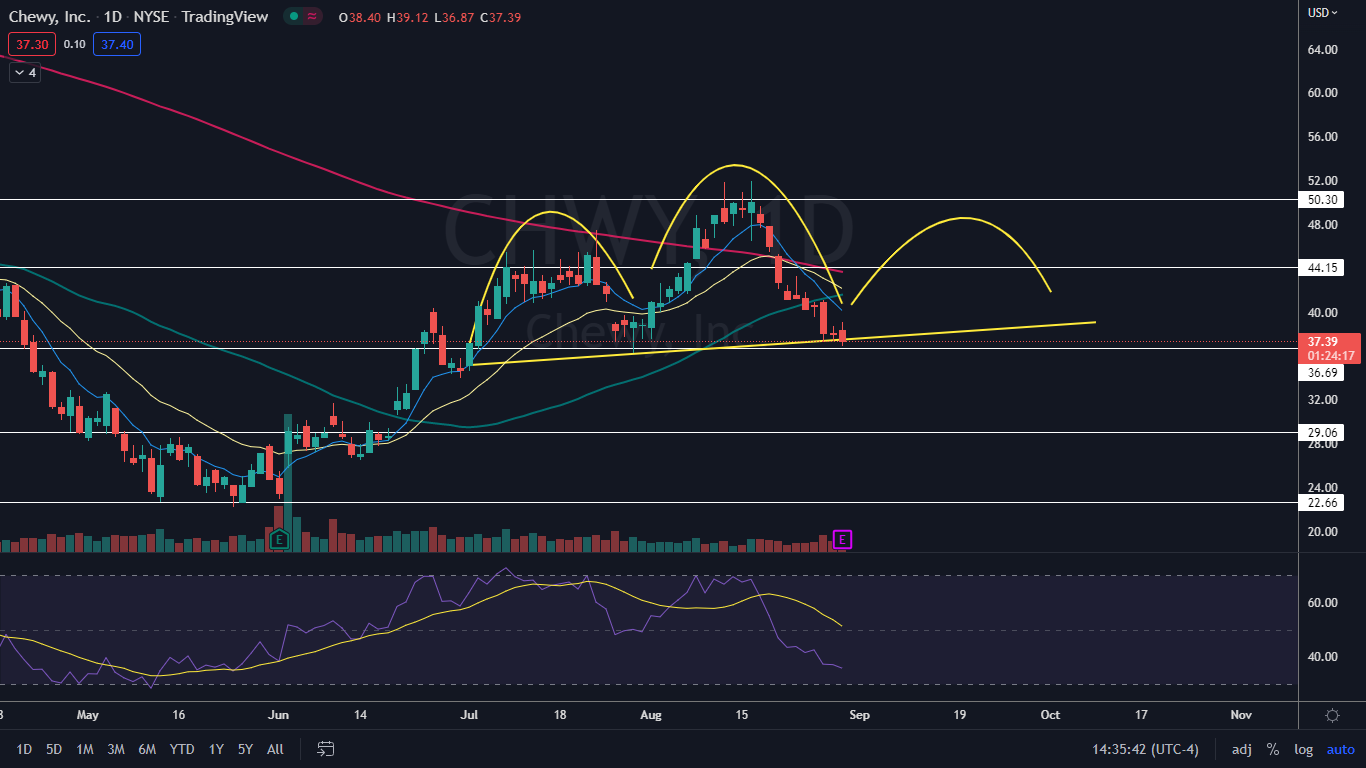
Photo via Shutterstock.