The Dow Jones Industrial Average is a key barometer of the U.S. stock market. Its 30 component stocks — such as Apple (AAPL) , Boeing (BA) , JPMorgan Chase (JPM) , and Walmart (WMT) — are a narrow representation of major industries in the U.S. economy.
Now, you can track one of the most widely followed equity indexes in the U.S. in real-time using Google Finance imported into Google Sheets. TheStreet has created a dynamic spreadsheet that updates throughout the trading day, and you can track basic data such as price, percent change, and market capitalization.
Related: How to protect data in Google Sheets: Preventing accidental changes
Here’s how we structured a spreadsheet for you to track the components of the Dow throughout the trading day. You can sort each stock by name, percent change, and market capitalization. You can also download the spreadsheet and customize it yourself.
The spreadsheet version of this tutorial can be downloaded here. Make a copy of the worksheet by selecting "Make a copy" from the drop-down in the File menu.
How to use this tracker
Google Finance allows you to select specific attributes such as the latest price, intraday high and low, and daily price change to monitor a particular stock. In this spreadsheet, we’ve listed the 20 available attributes for real-time monitoring in an in-cell drop-down list.
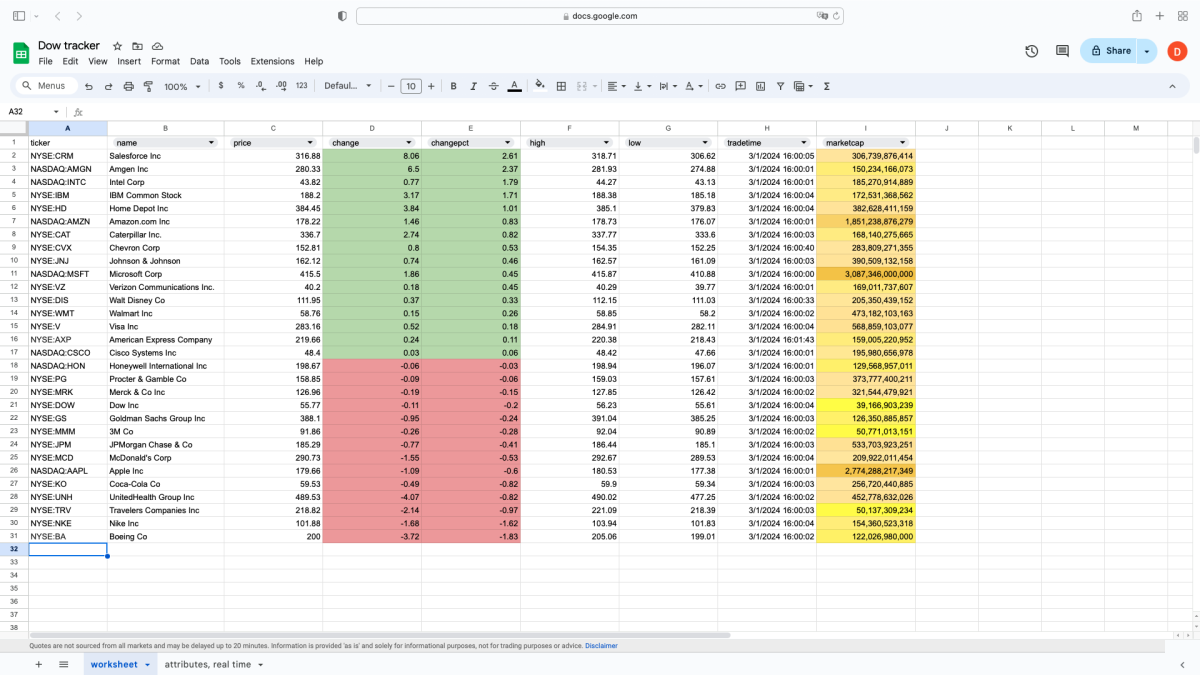
The first column (Column A) on the left lists the ticker symbols of the Dow stocks, and the seven successive columns to the right (Columns B to I) default to seven attributes: “name” (company name), “price” (latest available price), “change” (change in dollar value), “changepct” (percent change), “high” (intraday high price), “low” (intraday low price), “tradetime” (trading time of latest price), and “marketcap” (market capitalization in dollars).
Each of those seven columns has an in-cell drop-down list that you can change to any of the other 20 attributes.
To help visualize the data, we applied conditional formatting on some of the attributes, namely “change,” “changepct,” and “marketcap.” For “change” and “changepct,” an increase in the daily change in price highlights the cell in green, and a decrease highlights the cell in red. No change keeps the cell white.
For “marketcap,” the market values of the 30 Dow stocks take a color gradient, ranging from dark yellow for the companies with the largest capitalization shown at the top of the column to bright yellow for the smallest at the bottom.
To maintain the integrity of the macros used in the spreadsheet, “changepct” and “marketcap” (Columns E and I) are protected because changing the attribute of either in their respective column will likely lead to a different outcome when running their macros.
The keyboard shortcuts “Command + Option + Shift + 2” and “Command + Option + Shift + 3” sort the Dow stocks by percent change.
Running the macros
You can operate the macros using the drop-down menu or using keyboard shortcuts. Under “Extensions” in the menu bar of the spreadsheet, go to “Macros,” and a list of the macros will appear in the bottom section of the drop-down.
The name of the macro is listed to the left, and its keyboard shortcut (what keys to use) is listed to the right. The macros on this spreadsheet focus on sorting data by column.
Alternatively, you can use keyboard shortcuts. On the Mac OS, the keyboard shortcuts are as follows:
Command + Option + Shift + 1 — Name (Ascending)
Command + Option + Shift + 2 — Sort by % Change (Highest to Lowest)
Command + Option + Shift + 3 — Sort by % Change (Lowest to Highest)
Command + Option + Shift + 4 — Sort by Market Capitalization (Largest to Smallest)
The first macro allows you to sort the Dow stocks by name in Column B. After running the macro, 3M is at the top, Walt Disney Company is at the bottom, and all of the data from A2 to I31 move correspondingly in the data sort.
The second macro sorts the data by percent change from highest to lowest. In this function, stocks with the largest percent increases are at the top, and those with the lowest increases or largest percent decreases are at the bottom.
The third macro is the inverse of the second and sorts from lowest to highest percent change. (It makes sense to sort by percent change rather than price change because percent change shows how stock prices have changed relative to their previous closing prices.)
The fourth macro sorts companies by market capitalization, with the largest ones appearing at the top.
When you get used to running macros, you can create a fifth macro by sorting the Dow stocks by market capitalization from smallest to largest. Or, create macros to customize how you want to show the data.
Avoid making changes to the spreadsheet because any change will likely affect the outcome of running the macros. Macros run based on the spreadsheet’s cell range from A2 to I31 (headers aren’t affected unless there are changes to the attributes on the drop-down list).
However, you can make changes to the attributes for some of the columns, such as “price,” “change,” “high,” “low,” and “tradetime.” If you do want to customize the spreadsheet by adding columns of different attributes, consider editing the macros to accommodate changes in the cell range.
Note that Google Finance puts a disclaimer at the bottom of the spreadsheet to inform users of the limitations and usage of the stock data: “Quotes are not sourced from all markets and may be delayed up to 20 minutes. Information is provided 'as is' and solely for informational purposes, not for trading purposes or advice.”
So, trading on this information is at your own risk.
Again, we've already done all the work for you. The spreadsheet version of this tutorial can be downloaded here. Easily make a copy of the worksheet by selecting "Make a copy" from the drop-down in the File menu.
Watch the Dow tracker video tutorial
This is just one of many articles about easy-to-use tools in Google Sheets. See some of the highlights below and let us know what you'd like to see next. Email us here: tools@thearenagroup.net
Related: How to track stocks from Google Finance in Google Sheets
Related: How to create a stock tracker with live data using Google Finance
Related: How to create an in-cell dropdown list on Google Sheets
Related: How to use conditional formatting in Google Sheets: Ranges, formulas & more