/S%26P%20Global%20Inc%20phone%20and%20website-by%20T_Schneider%20via%20Shutterstock.jpg)
With a market cap of $125.5 billion, S&P Global Inc. (SPGI) is a leading provider of credit ratings, benchmarks, analytics, and workflow solutions across global capital, commodity, and automotive markets. The company operates through five key segments: Market Intelligence, Ratings, Energy, Mobility, and S&P Dow Jones Indices.
Companies valued at $10 billion or more are generally classified as “large-cap” stocks, and S&P Global fits this criterion perfectly. Its offerings range from multi-asset-class data platforms and enterprise software solutions to independent credit ratings, commodity price benchmarks, and automotive industry insights.
Shares of the New York-based company have declined 26.8% from its 52-week high of $579.05. Over the past three months, its shares have decreased 4.1%, underperforming the broader State Street Financial Select Sector SPDR ETF’s (XLF) marginal rise during the same period.
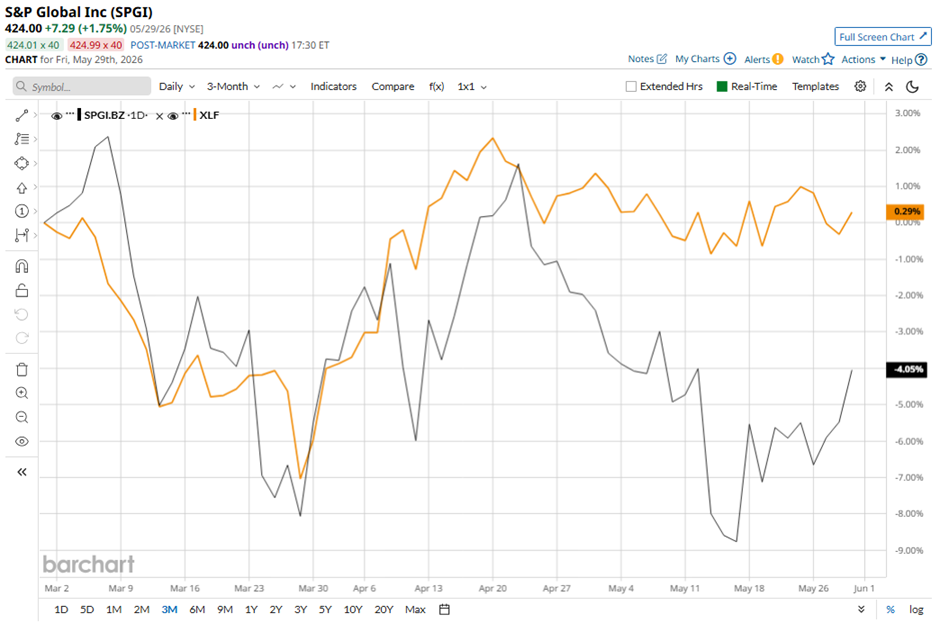
SPGI stock is down 18.9% on a YTD basis, lagging behind XLF's 5.8% drop. Longer term, shares of the independent ratings and analytics provider have dipped 17.1% over the past 52 weeks, compared to XLF’s nearly 2% return over the same time frame.
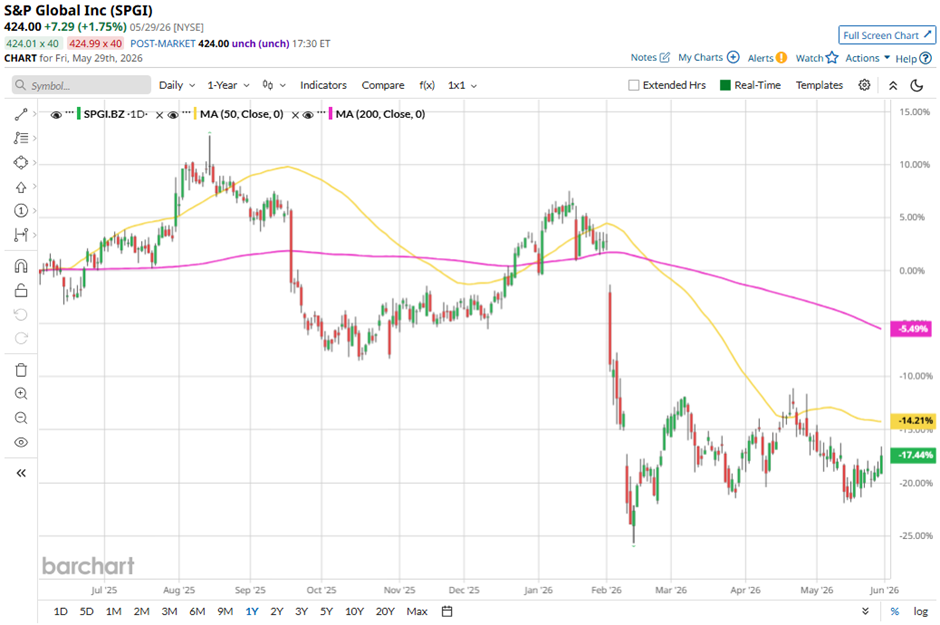
Despite a few fluctuations, the stock has been trading below its 50-day moving average since late August and below its 200-day moving average since mid-September last year.
Shares of S&P Global fell marginally on Apr. 28 as investors reacted to the company's reduced full-year 2026 revenue growth guidance of 6.3% - 8.3%, down from the previous 6.6%–8.6%, primarily due to lower expected foreign-exchange tailwinds. The cautious outlook overshadowed an otherwise strong Q1 2026 in which revenue rose 10% year-over-year to $4.17 billion and adjusted EPS increased 14% to $4.97, both exceeding analyst estimates.
Investor sentiment was also tempered because the company maintained its 2026 adjusted EPS guidance at $19.40 - $19.65, with the midpoint slightly below the consensus expectation.
In comparison, rival Berkshire Hathaway Inc. (BRK.B) has outperformed SPGI stock. BRK.B stock has declined 5.6% YTD and 5.7% over the past 52 weeks.
Despite the stock’s underperformance, analysts remain strongly optimistic about its prospects. The stock has a consensus rating of “Strong Buy” from 26 analysts in coverage, and the mean price target of $542.68 is a premium of nearly 28% to current levels.