
According to the Pew Research Center, since 1970, the growth in income for the middle class has not kept pace with the growth in income for the upper class. Additionally, the share of total U.S. household income held by the middle class has significantly decreased.
Check Out: Are You Rich or Middle Class? 8 Ways To Tell That Go Beyond Your Paycheck
Read Next: 6 Subtly Genius Moves All Wealthy People Make With Their Money
Given these stats, it’s not too surprising that members of the middle class are struggling to get by in many of America’s largest cities. A GOBankingRates study looked at the 100 most populous U.S. cities to see where middle-class salaries go the furthest by analyzing each city’s cost of living expenditures, cost of housing and how much — if anything — is left over after covering these costs based on the median middle-class salary.
Here’s a closer look at how far the typical middle-class salary goes in America’s 25 largest cities by population.

New York City
- Population: 8,516,202
- Median household income: $79,713
- Annual cost of living: $91,888
- Leftover savings: -$12,175
Learn More: What Is the Estimated Median Income for the Upper-Middle Class in 2025?
For You: 3 Signs You’ve ‘Made It’ Financially, According to Financial Influencer Genesis Hinckley
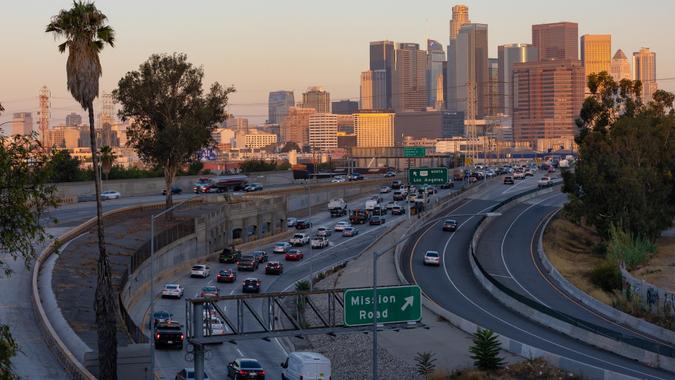
Los Angeles
- Population: 3,857,897
- Median household income: $80,366
- Annual cost of living: $97,110
- Leftover savings: -$16,744
Trending Now: What Salary Single People Need To Live Comfortably in 100 Major US Cities
Chicago
- Population: 2,707,648
- Median household income: $75,134
- Annual cost of living: $48,231
- Leftover savings: $26,903

Houston
- Population: 2,300,419
- Median household income: $62,894
- Annual cost of living: $42,540
- Leftover savings: $20,354

Phoenix
- Population: 1,624,832
- Median household income: $77,041
- Annual cost of living: $54,584
- Leftover savings: $22,457

Philadelphia
- Population: 1,582,432
- Median household income: $60,698
- Annual cost of living: $43,200
- Leftover savings: $17,498
Renting vs. Owning a Home: Which Is Cheaper in 2025?

San Antonio
- Population: 1,458,954
- Median household income: $62,917
- Annual cost of living: $39,476
- Leftover savings: $23,441

San Diego
- Population: 1,385,061
- Median household income: $104,321
- Annual cost of living: $105,204
- Leftover savings: -$833

Dallas
- Population: 1,299,553
- Median household income: $67,760
- Annual cost of living: $47,589
- Leftover savings: $20,171
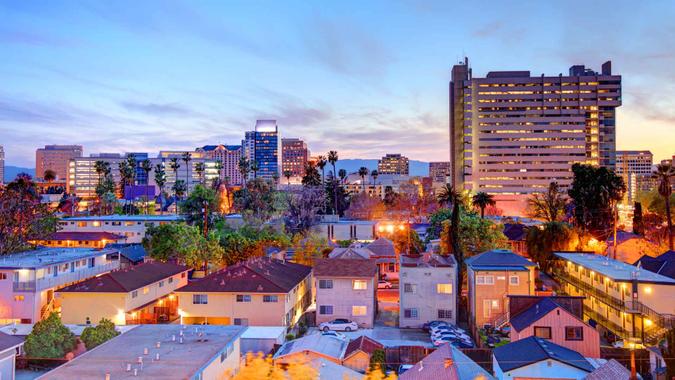
San Jose, California
- Population: 990,054
- Median household income: $141,565
- Annual cost of living: $135,604
- Leftover savings: $5,961
Be Aware: Salary Needed To Achieve the American Dream in the 50 Largest Cities

Austin, Texas
- Population: 967,862
- Median household income: $91,461
- Annual cost of living: $62,812
- Leftover savings: $28,649

Jacksonville, Florida
- Population: 961,739
- Median household income: $66,981
- Annual cost of living: $45,949
- Leftover savings: $21,032

Fort Worth, Texas
- Population: 941,311
- Median household income: $76,602
- Annual cost of living: $43,383
- Leftover savings: $33,219
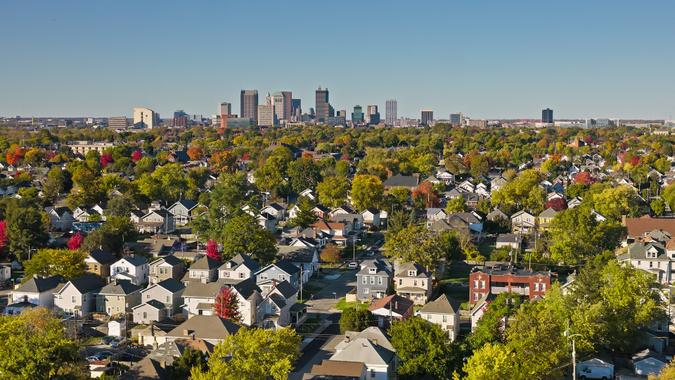
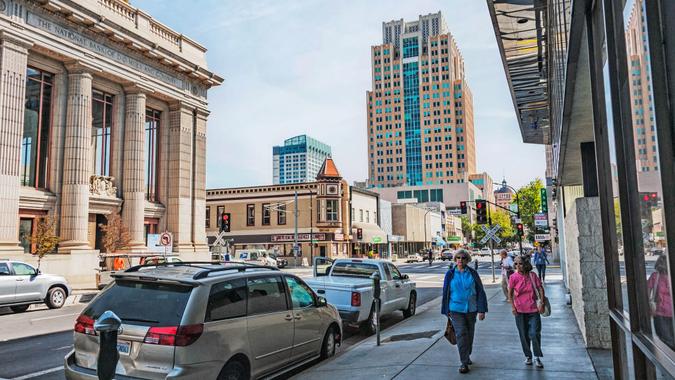
Columbus, Ohio
- Population: 906,480
- Median household income: $65,327
- Annual cost of living: $41,696
- Leftover savings: $23,631
Explore More: 20 Best Cities Where You Can Buy a House for Under $100K

Charlotte, North Carolina
- Population: 886,283
- Median household income: $78,438
- Annual cost of living: $52,687
- Leftover savings: $25,751

Indianapolis
- Population: 882,043
- Median household income: $62,995
- Annual cost of living: $39,262
- Leftover savings: $23,733

San Francisco
- Population: 836,321
- Median household income: $141,446
- Annual cost of living: $122,849
- Leftover savings: $18,597

Seattle
- Population: 741,440
- Median household income: $121,984
- Annual cost of living: $93,755
- Leftover savings: $28,229
Find Out: 9 Things the Middle Class Should Consider Downsizing To Save on Monthly Expenses

Denver
- Population: 713,734
- Median household income: $91,681
- Annual cost of living: $67,203
- Leftover savings: $24,478

Oklahoma City
- Population: 688,693
- Median household income: $66,702
- Annual cost of living: $38,391
- Leftover savings: $28,311

Nashville-Davidson, Tennessee
- Population: 684,298
- Median household income: $75,197
- Annual cost of living: $55,919
- Leftover savings: $19,278

El Paso, Texas
- Population: 678,147
- Median household income: $58,734
- Annual cost of living: $42,136
- Leftover savings: $16,598
Read More: 10 Things the Middle Class Won’t Be Able To Afford in Less Than a Decade

Washington, D.C.
- Population: 672,079
- Median household income: $106,287
- Annual cost of living: $79,455
- Leftover savings: $26,832
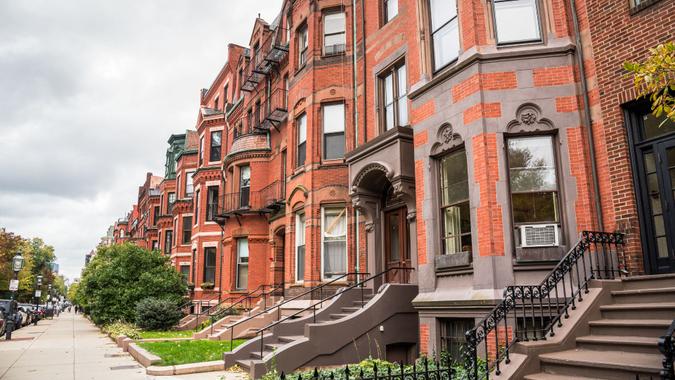
Boston
- Population: 663,972
- Median household income: $94,755
- Annual cost of living: $85,066
- Leftover savings: $9,689

Las Vegas
- Population: 650,873
- Median household income: $70,723
- Annual cost of living: $58,301
- Leftover savings: $12,422
Methodology: GOBankingRates analyzed the largest 100 cities by population to find out how far the typical middle class salary in each city will go. The cities were identified using the total population as sourced from the U.S. Census American Community Survey, along with the total households and household median income. The cost of living indexes were sourced from Sperlings BestPlaces and using the national average expenditure costs for all residents, as sourced from the Bureau of Labor Statistics Consumer Expenditure Survey. The single family home value was sourced from Zillow Home Value Index and by assuming a 10% downpayment and using the national average 30-year fixed mortgage rate, as sourced from the Federal Reserve Economic Data, the average mortgage cost can be calculated. Using the average expenditure and mortgage cost, the total cost of living can be calculated. Pew Research defines the middle class as two-thirds to double the median household income. Using this definition, GOBankingRates used the median household income for each location along with the total cost of living to find the leftover savings or additional income needed for the typical middle class households to afford the total cost of living. The cities were sorted to show the largest deficit from median household income first. All data was collected on and is up to date as of May 29th, 2025.
Gabriella Olya contributed to a previous version of this gallery.
More From GOBankingRates
This article originally appeared on GOBankingRates.com: How Far a Typical Middle-Class Salary Goes in America’s 25 Largest Cities