
Could you get by on a $50,000 salary in your state?
Based on average yearly expenditures for people making between $50,000 and $69,000, it doesn’t look promising. There isn’t a single state in which $50,000 would completely take care of those expenses.
Find Out: What Is the Estimated Median Income for the Upper-Middle Class in 2025?
Learn More: 4 Housing Markets That Have Plummeted in Value Over the Past 5 Years
That’s according to a recent GOBankingRates analysis of data from the Bureau of Labor Statistics and the Missouri Economic Research and Information Center. GBR used this data to generate a list of all 50 states, ranked by the percentage of annual expenditures $50,000 a year will cover (most to least).
Here’s the full list, along with each state’s cost-of-living index, average annual expenditures for the $50,000 to $69,999 price range and other related information.
Also see how far a $100,000 salary will go in every state.

1. Oklahoma
- Cost-of-living index: 85.5
- Annual expenditures: $50,839
- % of annual expenditures that $50K covers: 98.35%
With the lowest cost-of-living index in the nation, Oklahoma leads the way in percentage of annual expenditures that $50,000 covers. The Sooner State trails only Arkansas for the lowest grocery score with 95.7. Transportation costs come in at 86.7 (lowest in the nation), and housing comes in at 70.5 (second lowest). Utilities (94.7) are only the 20th lowest, however.
See Next: Here’s the Minimum Net Worth To Be Considered Upper Class in Your 50s
Discover More: What Salary Single People Need To Live Comfortably in 100 Major US Cities
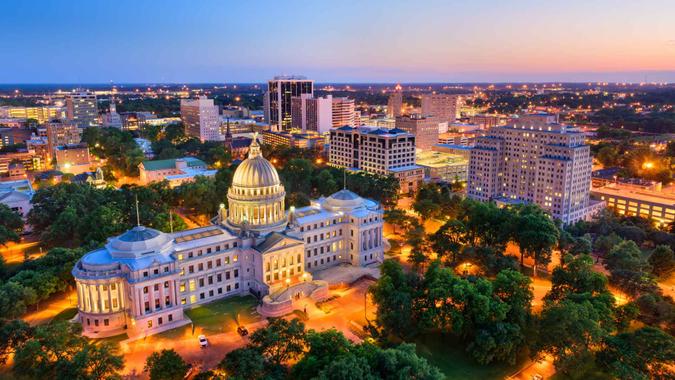
2. Mississippi
- Cost-of-living index: 87.3
- Annual expenditures: $51,909
- % of annual expenditures that $50K covers: 96.32%
Mississippi has the nation’s fourth-least expensive groceries. Housing costs are also the fourth lowest, with average annual costs around $9,400 for people making $50,000 to $69,000 a year.
Check Out: Here’s the Minimum Salary Required To Be Considered Upper-Middle Class in 2025

3. Alabama
- Cost-of-living index: 87.6
- Annual expenditures: $52,088
- % of annual expenditures that $50K covers: 95.99%
Alabama has the nation’s lowest cost-of-living score for housing at 69.1. That translates into average monthly housing expenditures of just under $750.
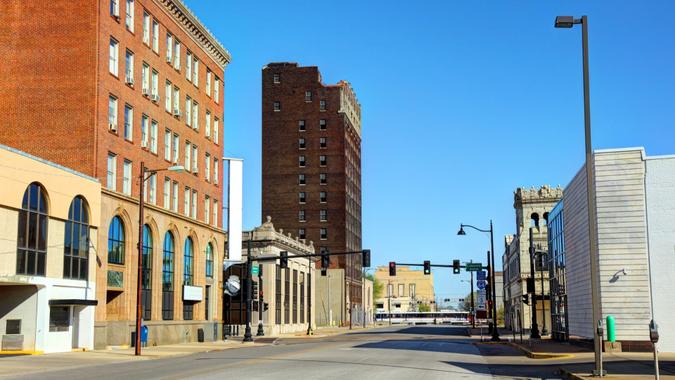
4. Missouri
- Cost-of-living index: 88.0
- Annual expenditures: $52,326
- % of annual expenditures that $50K covers: 95.56%
Missouri is closer to the middle of the pack on average utility costs at about $350 a month. The Show Me State is tied for the seventh-lowest grocery score (96.7) and has the sixth-least expensive housing (74.8), the second-least expensive transportation (87.2) and the ninth-least expensive housing (91.0).

5. West Virginia
- Cost-of-living index: 88.6
- Annual expenditures: $52,682
- % of annual expenditures that $50K covers: 94.91%
Monthly grocery expenditures in West Virginia are $450 on average, tied for seventh lowest in the country. Healthcare costs in the Mountain State are the nation’s 12th lowest, coming in at $431 a month on average.
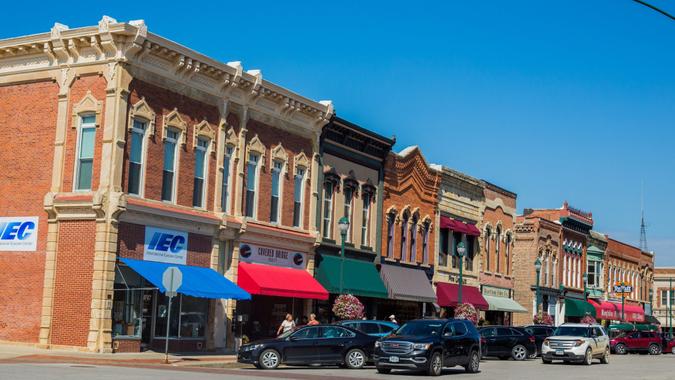
6. Iowa
- Cost-of-living index: 89.6
- Annual expenditures: $53,277
- % of annual expenditures that $50K covers: 93.85%
Iowa has the nation’s third-lowest cost-of-living score for groceries, with monthly expenditures of $441. The Hawkeye State has the 11th lowest score for housing, 77.7 with 100 as the U.S. median.

7. Kansas
- Cost-of-living index: 89.7
- Annual expenditures: $53,337
- % of annual expenditures that $50K covers: 93.74%
Kansas has the nation’s sixth-least expensive groceries, with average expenditures of $445 a month. Housing is the eighth-least expensive (75.6 on a scale of 100).
Read Next: Salary Needed To Achieve the American Dream in the 50 Largest Cities

8. Michigan
- Cost-of-living index: 89.8
- Annual expenditure: $53,396
- % of annual expenditures that $50K covers: 93.64%
For average grocery costs, Michigan sits in the middle of the pack with average monthly expenditures of $456. Housing is relatively inexpensive, though. Michigan’s housing cost index (73.9) is the nation’s fifth lowest.

9. Tennessee
- Cost-of-living index: 90.0
- Annual expenditures: $53,515
- % of annual expenditures that $50K covers: 93.43%
The Volunteer State is tied for the seventh-lowest grocery expenditures in the nation, about $446 a month. Transportation costs are among the lowest in the country — $392 a month on average.
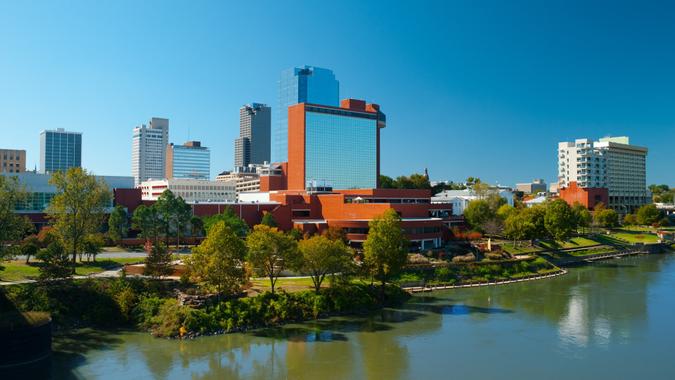
10. Arkansas
- Cost-of-living index: 90.5
- Annual expenditure: $53,812
- % of annual expenditures that $50K covers: 92.92%
You’ll find the nation’s least expensive groceries in Arkansas, with the state’s cost-of-living index coming in at 95.1. Average healthcare costs are the nation’s second lowest (85.4), trailing only Nevada.

11. Indiana
- Cost-of-living index: 90.8
- Annual expenditures: $53,991
- % of annual expenditures that $50K covers: 92.61%
The Hoosier State comes in just below the median for grocery costs, scoring a 98. Housing in Indiana comes in further below the median at 76.
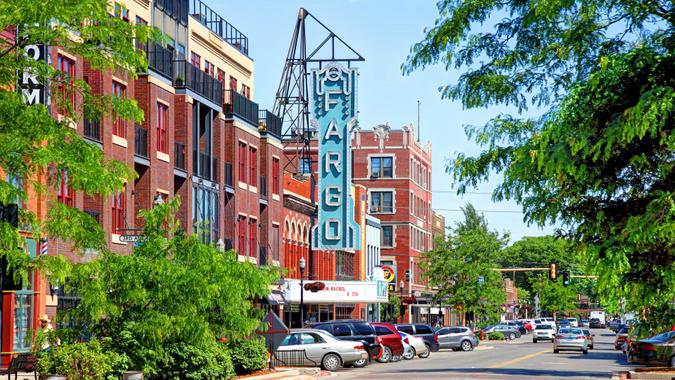
12. North Dakota
- Cost-of-living index: 90.8
- Annual expenditures: $53,991
- % of annual expenditures that $50K covers: 92.61%
Groceries in North Dakota will run you $448 a month on average, which is 3% below average. Housing is the 10th least expensive — 23% cheaper than average.
Try This: 9 Things the Middle Class Should Consider Downsizing To Save on Monthly Expenses
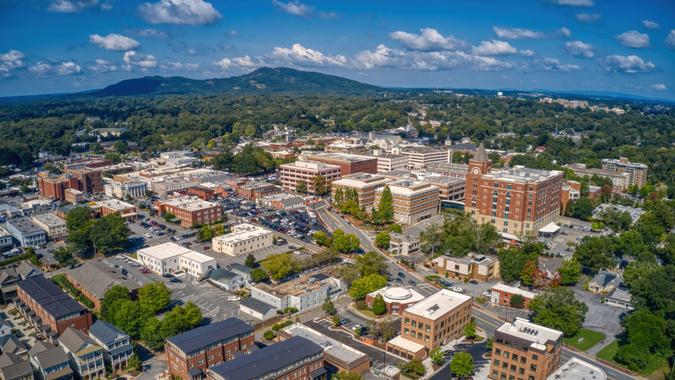
13. Georgia
- Cost-of-living index: 91.7
- Annual expenditures: $54,526
- % of annual expenditures that $50K covers: 91.70%
Utilities in Georgia are relatively expensive, with average monthly costs at $373 — 10th highest in the country. The Peach State ranks 14th lowest for groceries with a cost-of-living index of 97.7.

14. Kentucky
- Cost-of-living index: 91.7
- Annual expenditures: $54,526
- % of annual expenditures that $50K covers: 91.70%
Housing in Kentucky is the nation’s seventh-least expensive, scoring a 75 compared to the national median of 100. Monthly housing expenditures in the Bluegrass State come in at $811 on average.

15. Texas
- Cost-of-living index: 91.8
- Annual expenditures: $54,585
- % of annual expenditures that $50K covers: 91.60%
Texas has the country’s fourth-least expensive grocery expenditures with a cost-of-living index of 95.8. Texans who make between $50,000 and $69,999 a year pay about $563 a month on average. Residents of the Longhorn State pay more than the national average for utilities — $375 each month on average.
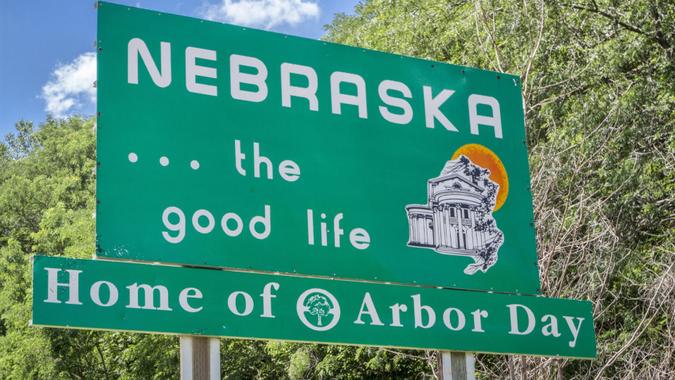
16. Nebraska
- Cost-of-living index: 92.4
- Annual expenditures: $54,942
- % of annual expenditures that $50K covers: 91.01%
Housing expenditures in Nebraska come in around $10,200 annually, the 12th-lowest figure in the nation. Utilities and transportation are each the 14th lowest.

17. Louisiana
- Cost-of-living index: 93.2
- Annual expenditures: $55,418
- % of annual expenditures that $50K covers: 90.22%
Louisiana has the country’s third-lowest utilities expenditures, with residents paying $296 a month on average. The Bayou State has the seventh-lowest grocery expenditures and 18th-lowest housing expenditures.
Trending Now: How Much You Need To Earn To Be Upper Middle Class in Every State
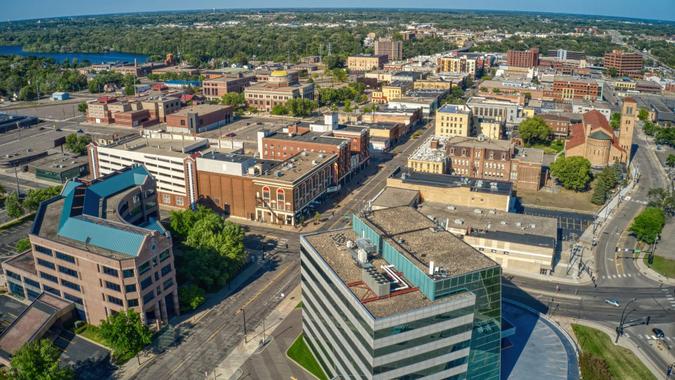
18. Minnesota
- Cost-of-living index: 93.7
- Annual expenditures: $55,715
- % of annual expenditures that $50K covers: 89.74%
Minnesota ranks 15th among states with the lowest housing expenditures. The Gopher States sits in the middle of the pack for grocery expenditures and other costs.
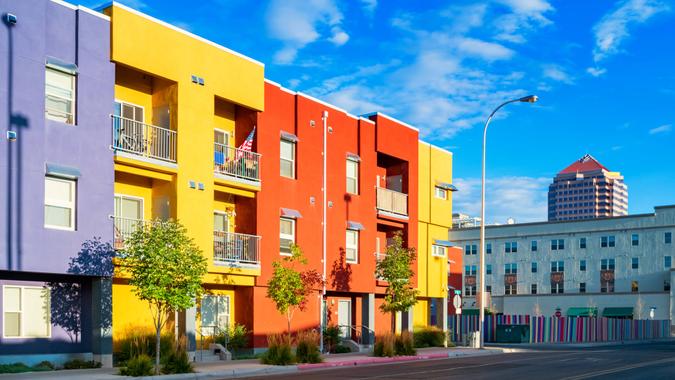
19. New Mexico
- Cost-of-living index: 94.2
- Annual expenditures: $56,012
- % of annual expenditures that $50K covers: 89.27%
New Mexico residents pay about 98% of the national median for groceries, about $450 each month on average. Housing costs sit in the middle of the pack, with a cost-of-living index of 90.2.
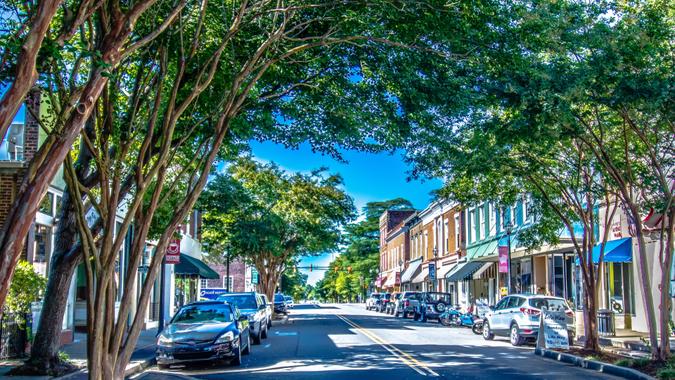
20. South Carolina
- Cost-of-living index: 94.6
- Annual expenditure: $56,250
- % of annual expenditures that $50K covers: 88.89%
Groceries in South Carolina cost $456 a month on average, which places the Palmetto State in the middle of the pack. Healthcare expenditures are the 15th lowest in the nation.

21. Illinois
- Cost-of-living index: 94.7
- Annual expenditures: $56,310
- % of annual expenditures that $50K covers: 88.79%
Average expenditures in Illinois rank in the middle of the pack across all categories. Groceries come in just below the national median, with average monthly costs sitting at $454.
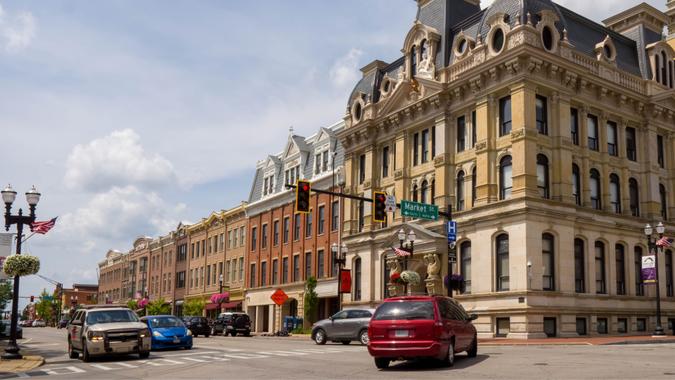
22. Ohio
- Cost-of-living index: 95.1
- Annual expenditures: $56,547
- % of annual expenditures that $50K covers: 88.42%
Ohioans pay just below the national median for groceries, with the Buckeye State’s cost-of-living score at 99.6. Ohio residents pay 86.7% of the national median for housing, which pencils out to an average of $937 a month.
View Next: Here’s the Minimum Salary Required To Be Considered Upper Class in 2025
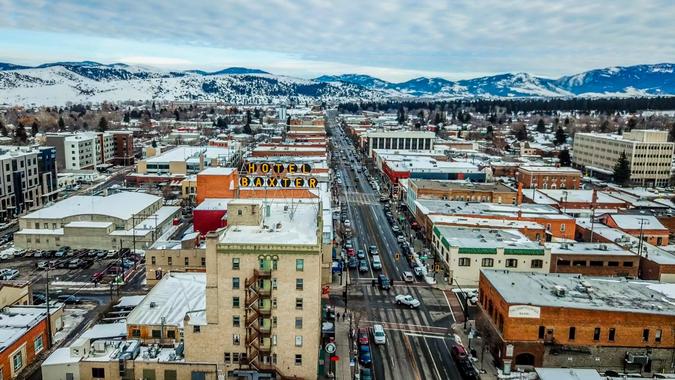
23. Montana
- Cost-of-living index: 96.4
- Annual expenditures: $57,320
- % of annual expenditures that $50K covers: 87.23%
Montana has the nation’s ninth-highest grocery expenditures. Utilities are the second-least expensive in the nation, trailing only Idaho.
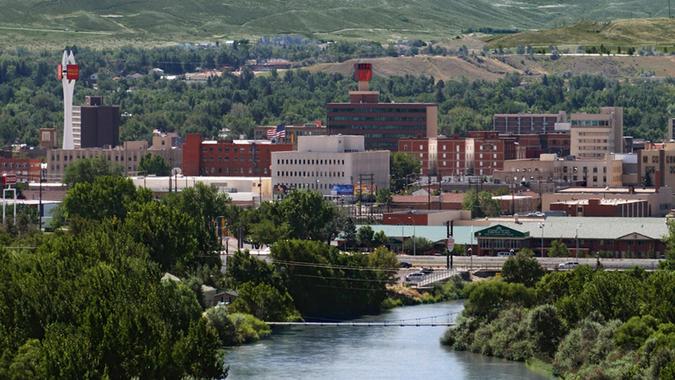
24. Wyoming
- Cost-of-living index: 97.0
- Annual expenditures: $57,677
- % of annual expenditures that $50K covers: 86.69%
Wyoming residents pay just over the national median for groceries, about $470 a month. Housing costs come in around $1,275 a month.

25. South Dakota
- Cost-of-living index: 97.3
- Annual expenditures: $57,856
- % of annual expenditures that $50K covers: 86.42%
South Dakota residents pay about 3.5% more than the national median for groceries — about $608 a month. South Dakota ranks right in the middle (25th) on housing costs at $986 a month.

26. Pennsylvania
- Cost-of-living index: 97.5
- Annual expenditures: $57,974
- % of annual expenditures that $50K covers: 86.24%
The Keystone State has the nation’s 12 lowest grocery expenditures, scoring a 97.4 to the national median of 100. Utility expenditures are the 11th most expensive.

27. North Carolina
- Cost-of-living index: 97.8
- Annual expenditures: $58,153
- % of annual expenditures that $50K covers: 85.98%
North Carolina has the nation’s 10th-highest healthcare expenditures. The Tar Heel State scores below the national median in other categories, including groceries (97.7), housing (94.9), utilities (94.7) and transportation (92.9).
Discover More: Warren Buffett’s Top 4 Tips for Getting Richer
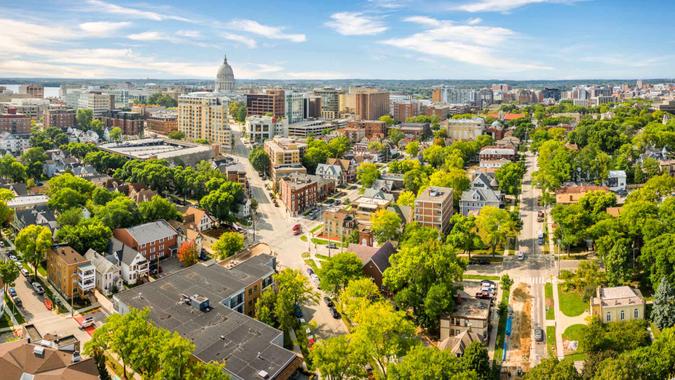
28. Wisconsin
- Cost-of-living index: 99.5
- Annual expenditures: $59,164
- % of annual expenditures that $50K covers: 84.51%
Wisconsin residents pay slightly below the national median for groceries, $459 on average. Housing is also just below the national median, with average expenditures of $1,087 a month.

29. Nevada
- Cost-of-living index: 99.5
- Annual expenditures: $59,164
- % of annual expenditures that $50K covers: 84.51%
Nevada residents have the lowest healthcare expenditures in the nation, paying about 85% of the national median. That translates into an average of $389 a month.

30. Utah
- Cost-of-living index: 100.5
- Annual expenditures: $59,758
- % of annual expenditures that $50K covers: 83.67%
Utah residents enjoy the fifth-lowest healthcare expenditures in the country. Utilities are also the fifth lowest.

31. Virginia
- Cost-of-living index: 101.4
- Annual expenditure: $60,293
- % of annual expenditures that $50K covers: 82.93%
Virginia’s average expenditures are mid-level compared to other states. The Old Dominion State does have the country’s 13th-lowest transportation expenditures.

32. Idaho
- Cost-of-living index: 102.0
- Annual expenditure: $60,650
- % of annual expenditures that $50K covers: 82.44%
Idahoans pay only about 74% of the national median for utilities — $268 each month on average. That’s the lowest in the nation. Transportation costs are the nation’s ninth highest.
Be Aware: Mark Cuban Tells Americans To Stock Up on Consumables as Trump’s Tariffs Hit — Here’s What To Buy

33. Florida
- Cost-of-living index: 102.0
- Annual expenditures: $60,650
- % of annual expenditures that $50K covers: 82.44%
Floridians pay 5% over the national median for groceries and about 6% over from housing. Healthcare comes in below the national median at $412 a month on average.

34. Delaware
- Cost-of-living index: 103.5
- Annual expenditures: $61,542
- % of annual expenditures that $50K covers: 81.25%
Delaware has the nation’s 17th-highest healthcare expenditures, with residents paying nearly 7% more than the national median. The First State ranks in the middle of the pack in other expenditure categories.

35. Colorado
- Cost-of-living index: 104.0
- Annual expenditures: $61,839
- % of annual expenditures that $50K covers: 80.85%
Colorado scores a 102.6 on grocery expenditures. That translates to $473 each month on average.

36. Rhode Island
- Cost-of-living index: 109.3
- Annual expenditures: $64,991
- % of annual expenditures that $50K covers: 76.93%
Utility expenditures in tiny Rhode Island are the fifth highest in the country. Rhode Island sits near the middle of the pack across other expenditure categories.
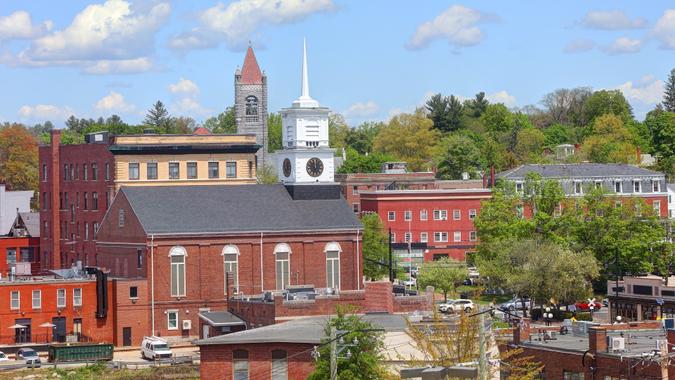
37. New Hampshire
- Cost-of-living index: 110.1
- Annual expenditure: $65,467
- % of annual expenditures that $50K covers: 76.37%
The Granite State has the nation’s 15th-most expensive housing costs, with residents paying $1,256 each month on average.
For You: The Living Wage a Family of 4 Needs in All 50 States
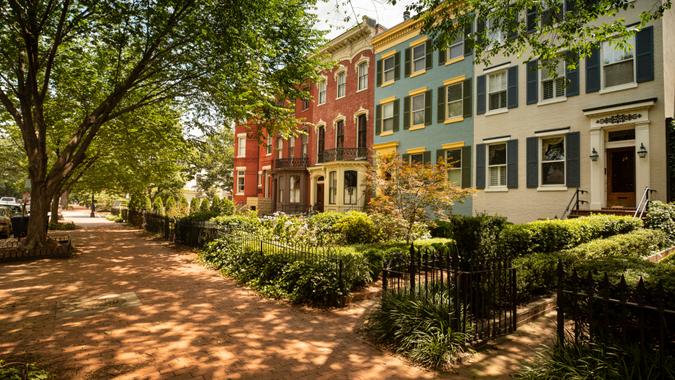
38. Washington
- Cost-of-living index: 112.0
- Annual expenditures: $66,596
- % of annual expenditures that $50K covers: 75.08%
Groceries in the Evergreen State come in about 8% higher than the national median, with monthly expenditures at $500 on average. Housing is the nation’s 14th highest.

39. Arizona
- Cost-of-living index: 112.5
- Annual expenditures: $66,894
- % of annual expenditures that $50K covers: 74.75%
Arizona’s cost-of-living index for housing comes in at 34.8% above the national average. That ranks the Grand Canyon State seventh in the country for the most expensive housing.

40. Oregon
- Cost-of-living index: 112.7
- Annual expenditures: $67,013
- % of annual expenditures that $50K covers: 74.61%
Oregon has the nation’s seventh-most expensive groceries, 11th-most expensive housing, fifth-most expensive transportation and fifth-highest healthcare expenditures.
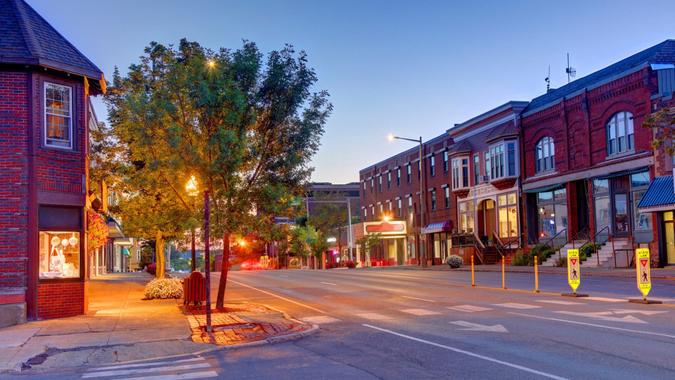
41. Maine
- Cost-of-living index: 113.4
- Annual expenditures: $67,429
- % of annual expenditures that $50K covers: 74.15%
Maine sits in the middle of the pack for grocery costs. But the Pine Tree State is relatively more expensive when it comes to housing; its cost-of-living index of 133.2 is the country’s ninth highest.

42. Connecticut
- Cost-of-living index: 113.5
- Annual expenditures: $67,488
- % of annual expenditures that $50K covers: 74.09%
Utilities are relatively expensive in Connecticut, with residents paying an average of $499 each month. That’s the fourth most in the nation.
That’s Interesting: What Is the Estimated Median Income for the Upper-Middle Class in 2025?

43. Vermont
- Cost-of-living index: 113.7
- Annual expenditures: $67,607
- % of annual expenditures that $50K covers: 73.96%
Vermont ranks in the top 12 for the most expensive groceries (fifth), most expensive housing (12th), most expensive utilities (ninth) and most expensive healthcare (eighth). Transportation costs are only the 19th-most expensive.

44. New Jersey
- Cost-of-living index: 114.8
- Annual expenditures: $68,261
- % of annual expenditures that $50K covers: 73.25%
New Jersey residents pay the sixth-highest average costs in the nation for housing — $1,550 a month. Healthcare is the 13th-most expensive.
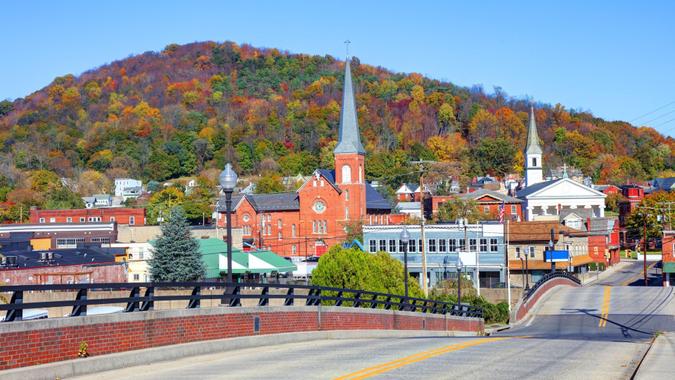
45. Maryland
- Cost-of-living index: 114.9
- Annual expenditure: $68,321
- % of annual expenditures that $50K covers: 73.18%
Maryland residents pay about 5% above the national median for groceries, which pencils out to $485 each month on average. Housing costs are the nation’s eighth priciest.

46. New York
- Cost-of-living index: 124.7
- Annual expenditures: $74,148
- % of annual expenditures that $50K covers: 67.43%
The cost of living in the Empire State varies widely based on where you live. Overall, New York has the country’s fifth-highest housing costs, 12th-most expensive groceries, seventh-most expensive transportation costs and 11th-most expensive healthcare.

47. Alaska
- Cost-of-living index: 127.3
- Annual expenditures: $75,694
- % of annual expenditures that $50K covers: 66.06%
Alaska has the nation’s most expensive healthcare, with residents who make between $50,000 and $70,000 a year paying $649 a month on average. Alaska also scores a sky-high 130.3 on grocery costs. Among all 50 states, only Hawaii has higher grocery prices.

48. California
- Cost-of-living index: 141.6
- Annual expenditures: $84,197
- % of annual expenditures that $50K covers: 59.38%
On average, Californians pay nearly double the national median for housing. Transportation is the nation’s second-most expensive, and groceries come in third. California ranks just 19th for the highest healthcare costs, however.

49. Massachusetts
- Cost-of-living index: 145.1
- Annual expenditures: $86,278
- % of annual expenditures that $50K covers: 57.95%
Residents of Massachusetts pay more than double the national median for housing. Healthcare in the Bay State is the nation’s second-most expensive, with average costs of $634 a month.

50. Hawaii
- Cost-of-living index: 182.3
- Annual expenditures: $108,397
- % of annual expenditures that $50K covers: 46.13%
Hawaii’s cost-of-living index is by far the nation’s highest, with a $50,000 salary covering only 46% of annual expenditures. The Aloha State has the highest grocery expenses ($621 a month). The housing cost-of-living index is a whopping 292.1, nearly three times the national median. Utilities and transportation are also the country’s highest. Healthcare costs trail only Alaska and Massachusetts.
Methodology: For this analysis, GOBankingRates first sourced the national average annual expenditures for people with incomes between $50,000 and $69,999 from the Bureau of Labor Statistics’ 2023 Consumer Expenditure Survey data. GBR then created state-level annual expenditure estimates by multiplying the national figure by each state’s overall cost-of-living index for Q1 2025 from the Missouri Economic Research and Information Center. Finally, GBR determined what percentage of annual expenditures is covered by $50,000 by dividing $50,000 by each state’s average annual expenditures estimate. All data was collected on and is up to date as of July 29, 2025.
More From GOBankingRates
This article originally appeared on GOBankingRates.com: How Far a $50K Salary Will Go in Every State


