Air pollution is often portrayed as something that affects entire cities. In fact, levels can vary enormously over just a few metres.
Our research shows that one of the greatest challenges for academics is not simply measuring air pollution, but making it visible and meaningful enough for people to recognise how it shapes their everyday lives.
Traditional air quality monitoring relies heavily on fixed monitoring stations, which are positioned at specific locations around a city. These stations provide highly accurate and valuable measurements, but they can only represent conditions at a limited number of points.
Air quality varies significantly across environments. It can also change dramatically over short distances and timescales depending on things like traffic volume, street layout, weather conditions, and local or regional sources of emissions. So, two people travelling along the same route at different times of the day may experience very different levels of exposure to pollutants in the air.
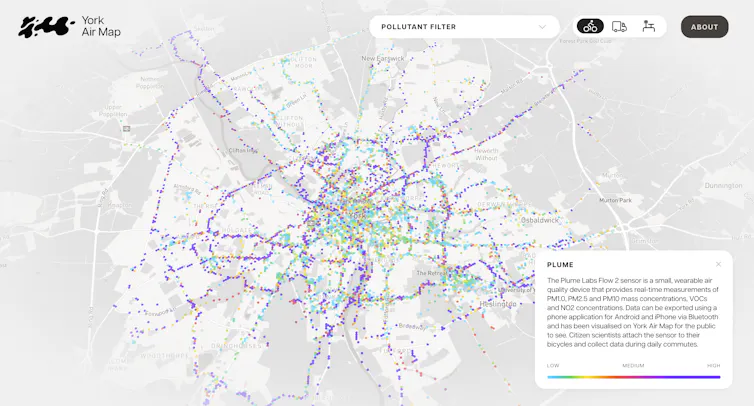
Combining scientific methods with creative approaches can help people better understand environmental issues that are otherwise difficult to perceive. We used our expertise in creative design and atmospheric science to create the York air map, an online resource designed to make complex environmental data more accessible, meaningful and relevant to people’s lives.
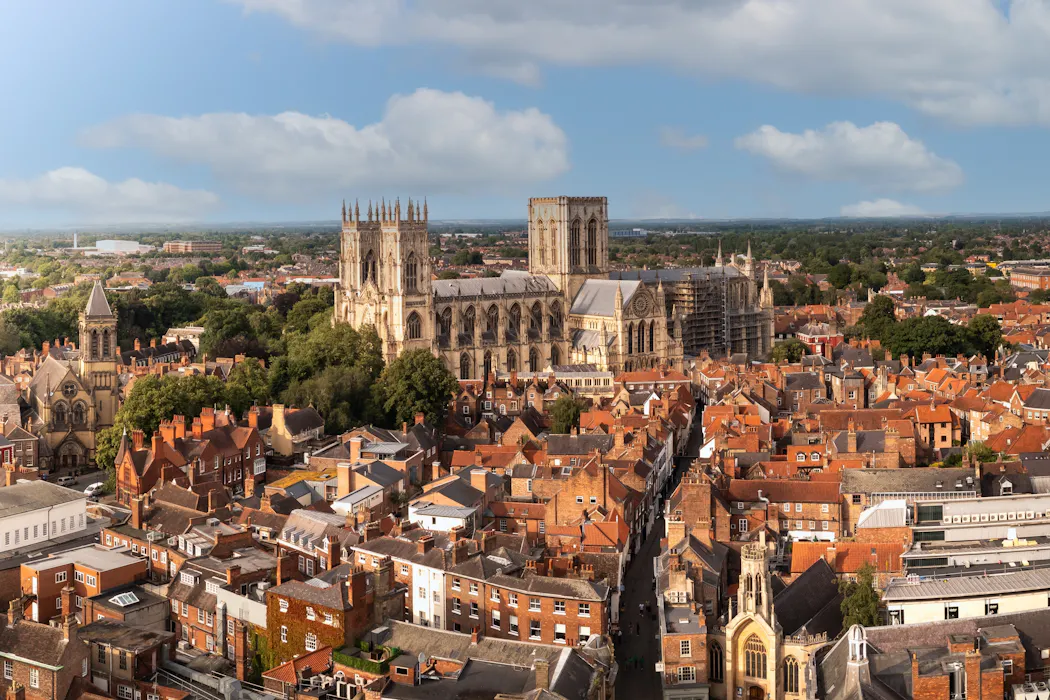
This project investigates urban air pollution using 16 small monitors attached to bicycles. We involved people as citizen scientists to collect data over six-week blocks during their daily cycling commutes across the city, which has a population of just over 200,000.
Through citizen science projects like this, people can collaborate with researchers and contribute to data monitoring programmes. And because these bicycles are being ridden through a wide range of spaces that might usually go unmeasured, this provides us with new data.
Each cyclist can see the data change in real-time through a commercial air quality sensor and accompanying phone app, so any spikes in air pollution can be attributed to what they are currently experiencing on the route. This helps people connect to the statistics in a more tangible way.
Read more: Using art to tackle air pollution: a story from a Nairobi slum
Our findings show that air pollution exposure is not evenly distributed across the city. Despite recognising some pollution hotspots, we have found that fluctuations can occur within short distances depending on external factors and the rider’s actions and movements.
For instance, are there road works happening? Are there high-polluting vehicles in front of you? Are you riding through a park or along a canal? Are you riding past active construction sites?
Because air pollution is so complex and is constantly changing, this research can challenge people’s perceptions of air quality. It is easy to assume, due to yearly averages, that pollution exposure in a city like York is low. But people can be exposed to high concentrations over short timescales – and repeated exposure in this way may cause long-term health effects.
Beyond scientific measurements
Our project champions citizen scientists to engage with the information in different ways.
York air map translates complex environmental data into forms that are accessible, engaging and relevant to wider audiences. One of us (Clare Nattress) has transformed air quality data into maps, visualisations, an informative zine, public exhibitions and community workshops designed to encourage discussion about air quality and environmental health.
We encouraged our 16 citizen scientists, seasonally, to write pollution diaries and record their daily experience of commuting to work or taking a leisurely bicycle ride. The diaries showed that riders became more attuned over time to their surroundings, noticing smells and sources more clearly when spikes showed up on the app.
One exhibition displayed smellable filters. These are small white filters that have been exposed to various sources in the laboratory. Visitors were invited to smell each one and guess which sources they came from.
This helped people recognise sources of air pollution such as wood burning, BBQs, perfumes and household cleaning products. They could then link our statistics with real sources of air pollution in their surroundings.
We each take roughly 20,000 breaths a day – and the quality of the air we breathe changes depending in part on the choices we make. Air pollution isn’t just a problem for big factories or capital cities; it’s happening right here on our streets and in our homes.
This article was originally published on The Conversation. Read the original article.