KB Home (KBH) and Lennar (LEN) posted earnings on Wednesday after the close and the reports couldn’t have come at a more interesting time.
On Wednesday the Federal Reserve raised interest rates by 0.75 percentage point, with plans to continue raising rates through the end of the year.
Chairman Jay Powell even spoke about the housing market specifically, noting that it would be healthy for it to see a correction. (It would also help ease inflation.)
That’s after 30-year mortgage rates hit their highest levels since 2008. Higher interest rates will only push mortgage rates higher in the meantime.
All that news preceded both of these companies reporting earnings. Both firms beat on earnings but missed on revenue, as sales grew 29% year over year for Lennar and 25% for KB Home.
Let’s look at the charts.
Trading Lennar Stock on Earnings
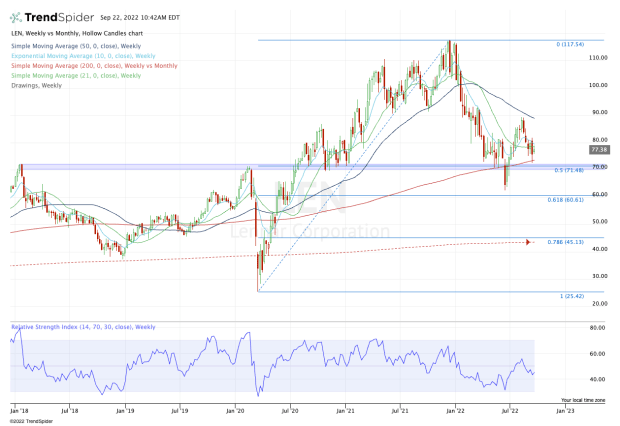
Chart courtesy of TrendSpider.com
Lennar is bucking the overall trend in the market today, with its shares up about 2.5% on the session. The stock is not leaping, but it is holding above a key level.
For those who expect the housing market to remain mostly intact — or expect homebuilders to escape the correction relatively unscathed and maintain somewhat steady margins and profitability — holding above this support level is a huge positive for the bulls.
Specifically, that’s as the shares stay above the $70 to $71.50 area.
In that zone, we have a key support/resistance pivot, the 200-week moving average and the 50% retracement from the all-time high to the 2020 low.
If this area breaks, it opens up the possibility that we retest the 2022 low near $62.50 and the 61.8% retracement near $60.50.
On the upside, bulls really need to see Lennar stock get above and stay above the $80 to $82 area. If it can do that, it puts the shares over the 10-week and 21-week moving averages and opens the door to the $89 area and the 50-week moving average.
Trading KB Home Stock on Earnings
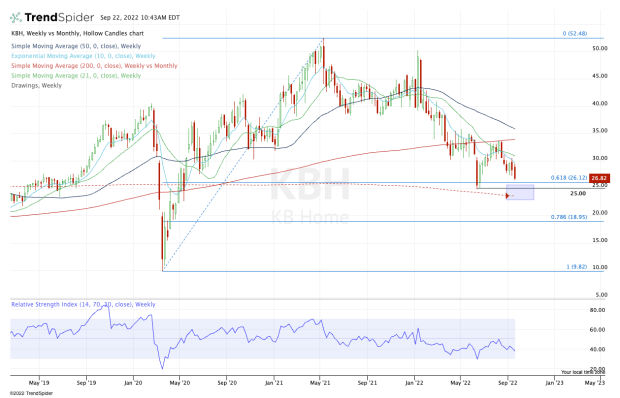
Chart courtesy of TrendSpider.com
KB Home stock is not performing as well as Lennar, with the shares down about 4% at last check.
With today’s decline, the shares are taking out several weeks worth of lows. If the stock trades below the $26 level, it opens the door down to the 2022 lows just below $25 and the declining 200-month moving average.
Below these levels and the $19 to $20 zone is in play.
On the upside, I see $30 to $32 as resistance, provided KB Home stock can get above its 10-week and 21-week moving averages.
Between the two, Lennar looks better from a technical perspective.