138% — that’s what we’re talking about.
Increasingly, I’ve been noticing an alarming trend where financial publication articles say a whole bunch without saying anything at all. It’s annoying. Earlier, I read an article from a source that shall be unnamed that spent a good part of the thesis explaining that prices rise when demand is strong.
In other news, wetness has a strong correlation with rain and analysts have confirmed that fire is still hot.
Let’s get into matters of true substance. Fast-food giant McDonald’s (MCD), despite being a reliable long-term investment, likely isn’t going to make options traders get up out of their seats. For example, MCD stock is up 5.48% on a year-to-date basis through Friday’s close. Even adding its dividend yield into the picture, the total return is well off the S&P 500’s 15.47% YTD lift.
Barchart’s Technical Opinion indicator perfectly embodies the banality of the upside prospect. Sure, MCD stock rates as an 8% Buy but the trend itself is defined as weak. A Moderate Buy consensus rating among Wall Street analysts — marked conspicuously by 19 individual Hold assessments — caps off the rather uninspiring narrative.
On surface level, even the options market seems like it’s conspiring against McDonald’s. On Friday, total options volume for MCD stock was only 10,802 contracts, representing a 29.7% drop from the trailing one-month average. Options flow — which focuses exclusively on big block transactions likely placed by institutional investors — showed that net trade sentiment slipped $19,700 below parity.
Finally, MCD stock only gained 0.18% in the trailing month. Traders are tired of the Golden Arches and its lackluster performance in the charts — and that’s exactly why it may soon be time to strike.
Using the Quantitative Approach to Navigate MCD Stock
Another criticism that I have about the finpub industry is the reliance on fundamental and technical analysis. These methodologies are essentially “workless” because of their lack of falsifiability. In other words, there are no null hypotheses to reject. Even more problematic, both the premise and the conclusion of the “analysis” are contingent on the author — rending the report as an unanchored opinion.
Quantitative analysis is different, in large part because the premise is built off non-contingent data. Unlike a head-and-shoulders pattern (in technical analysis), a quant signal is empirical. If one is identified, other quants can identify it too and run probabilistic analyses —and the outcome would be exactly the same. That cannot be said about traditional methodologies, which are ego-driven.
For MCD stock, in the past 10 weeks through Friday’s close, the security printed a 4-6-D sequence: four up weeks, six down weeks, with an overall downward trajectory. The pattern itself isn’t important, per se. Rather, we’re interested in isolating the forward 10-week response to the 4-6-D sequence as its own population group within the parent dataset of McDonald’s stock price history.
To make a long story short, we’re borrowing heavily from observations made by GARCH (Generalized Autoregressive Conditional Heteroskedasticity) studies, which describe the diffusional properties of volatility as a dependent, clustering phenomenon rather than a linear, orderly concept. Put another way, different market stimuli impart different market behavior.
Ultimately, the theory is that the 4-6-D sequence will impose an influence on MCD stock that will be different than the influence imposed on McDonald’s under normal baseline conditions. What’s more, we can use algorithms to measure this difference in influence, thus giving us an edge in understanding the delta between expected and likely outcomes.
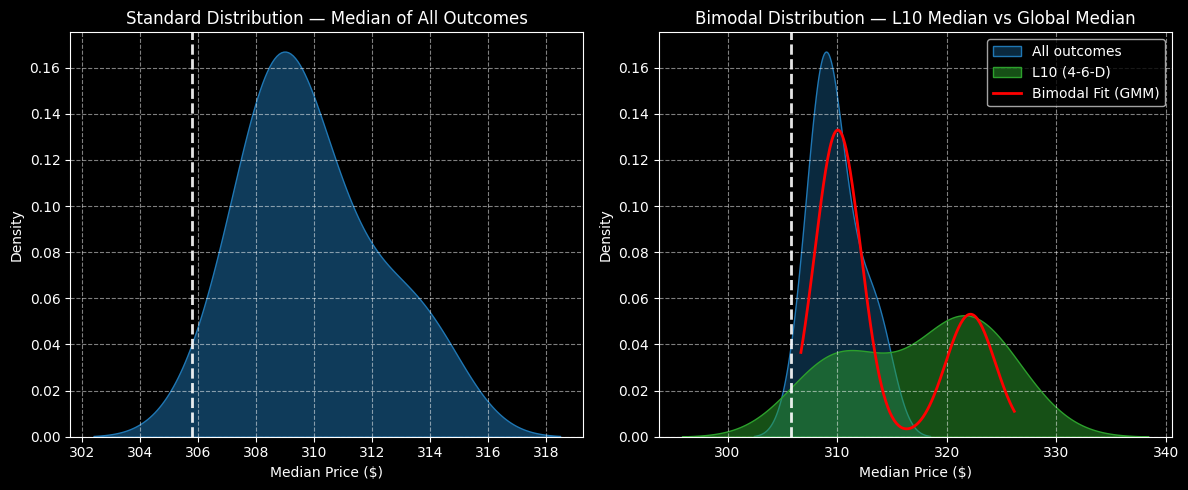
Specifically, under baseline conditions, we can expect MCD stock to cluster around $309 (assuming an anchor price of $305.79, Friday’s close). This clustering is calculated from historical pricing data going back to January 2019.
However, under 4-6-D conditions, price clustering should be most prominent at roughly $322. That’s a 4.21% positive delta in price clustering dynamics — which may not sound like much until you add the leverage of a vertical spread (bull call spread).
Eyeballing a Huge Payout
So, here’s why I mentioned 138% at the top of this article. That’s the maximum payout you would receive under the successful outcome of the 315/320 bull call spread expiring Dec. 19. MCD stock will need to rise through the second-leg strike price at expiration, which is a very realistic target based on McDonald’s statistical framework.
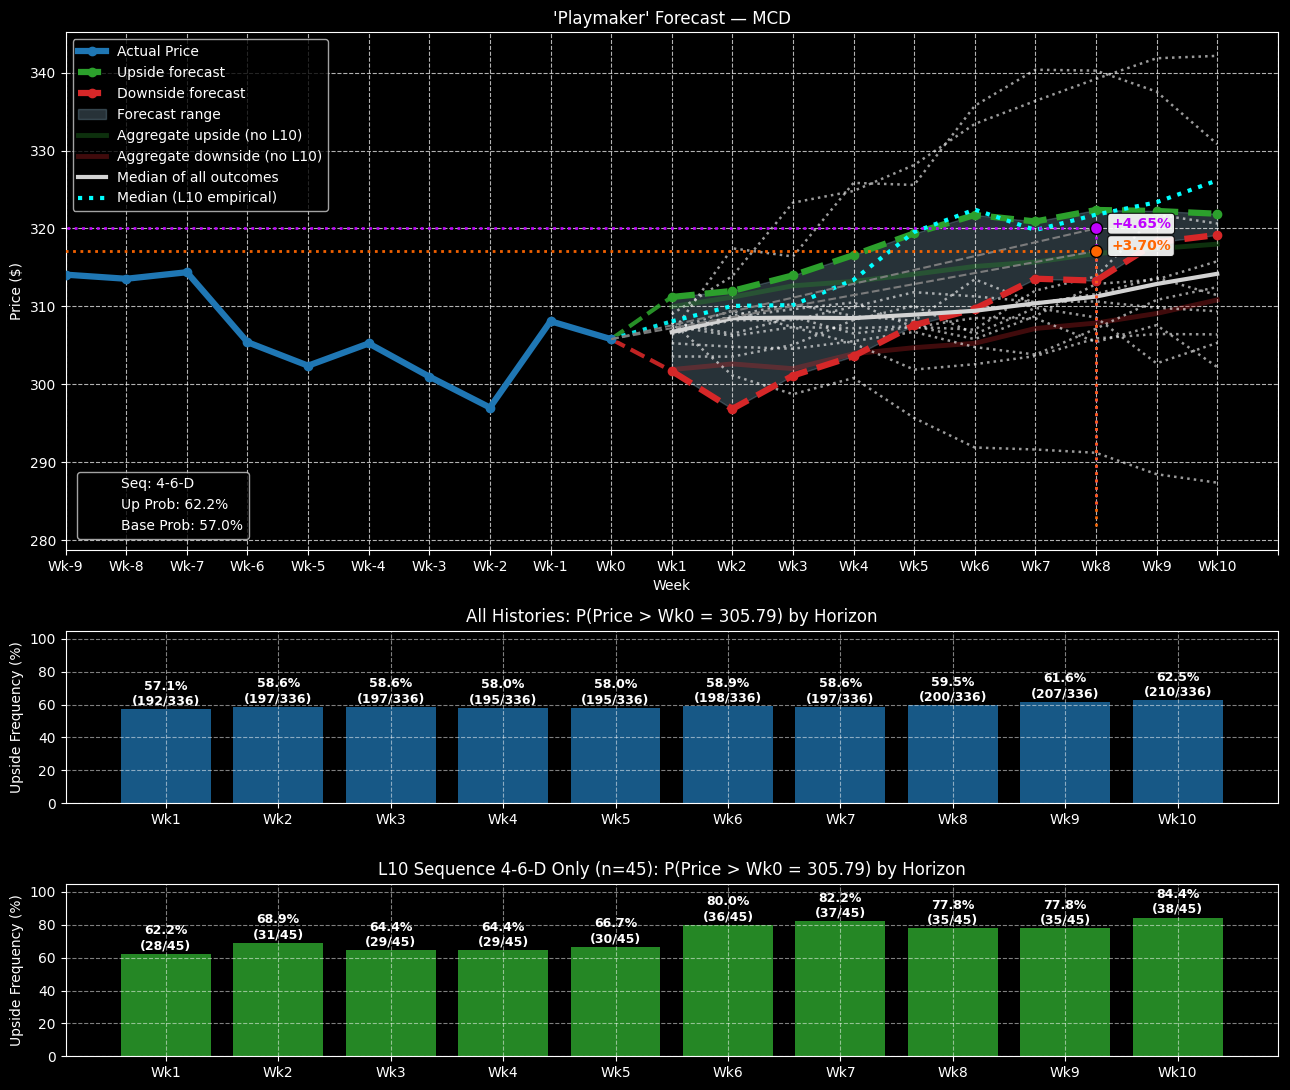
To repeat, price clustering would be projected to occur on average at $322. On a terminal basis, MCD stock could potentially hit between $323 to $325 over the next 10 weeks.
Probabilistically, I’m calculating a 77.8% exceedance rate on Week 8 or the chance that MCD will be above the starting point ($305.79). Moreover, the likelihood that MCD will be at $320 might be around 55%.
Using the Black-Scholes-Merton (BSM) approach, the probability of profit for the above trade is defined at only about 28.7%. Thus, I believe there’s a 26.3 percentage-point mispricing in your favor.