Exxon Mobil Corporation (NYSE:XOM) was trading flat on Wednesday after a big bullish day on Tuesday saw the stock gap up 1.53% and rally an additional 2.56% intraday.
The energy sector turned bullish on Aug. 5 after trading sideways since mid-June.
Despite the S&P 500 hitting a top on Aug. 16, Exxon has continued to surge higher since that date within a uptrend pattern.
An uptrend occurs when a stock consistently makes a series of higher highs and higher lows on the chart. The higher highs indicate the bulls are in control while the intermittent higher lows indicate consolidation periods.
Traders can use moving averages to help identify an uptrend, with rising lower time frame moving averages (such as the eight-day or 21-day exponential moving averages) indicating the stock is in a steep shorter-term uptrend.
Rising longer-term moving averages (such as the 200-day simple moving average) indicate a long-term uptrend.
A stock often signals when the higher high is in by printing a reversal candlestick such as a doji, bearish engulfing or hanging man candlestick. Likewise, the higher low could be signaled when a doji, morning star or hammer candlestick is printed. Moreover, the higher highs and higher lows often take place at resistance and support levels.
In an uptrend the "trend is your friend" until it’s not and in an uptrend there are ways for both bullish and bearish traders to participate in the stock:
- Bullish traders who are already holding a position in a stock can feel confident the uptrend will continue unless the stock makes a lower low. Traders looking to take a position in a stock trading in an uptrend can usually find the safest entry on the higher low.
- Bearish traders can enter the trade on the higher high and exit on the pullback. These traders can also enter when the uptrend breaks and the stock makes a lower low indicating a reversal into a downtrend may be in the cards.
Want direct analysis? Find me in the BZ Pro lounge! Click here for a free trial.
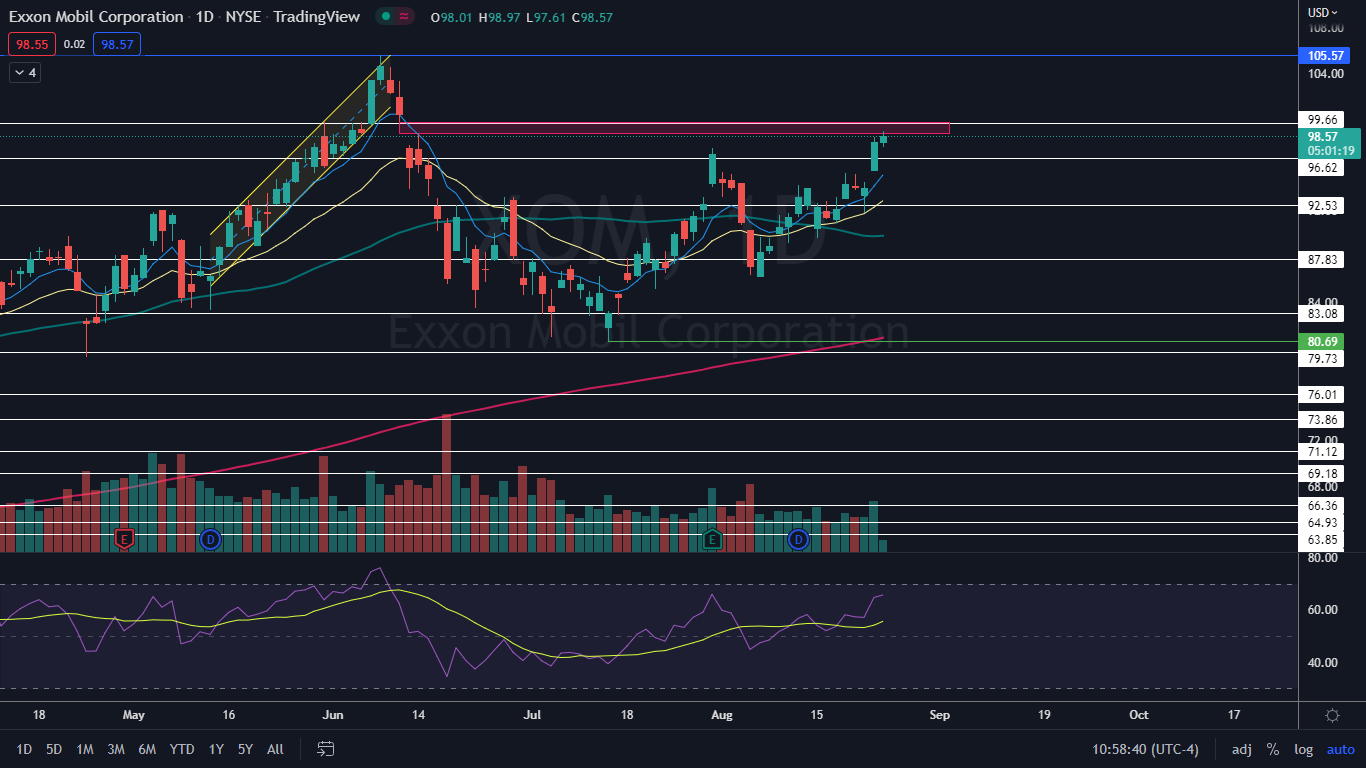
The Exxon Chart: The most recent higher low within Exxon’s uptrend was printed on Aug. 22 and $91.86 and the most recent confirmed higher high was formed at the $95.31 level on Aug. 18. On Tuesday and Wednesday, Exxon surged up above the Aug. 18 high-of-day but the stock hasn’t printed a reversal candlestick to indicate a retracement to the downside is imminent.
- On Tuesday, Exxon printed a bullish kicked candlestick, which indicated higher prices were likely to come on Wednesday. Exxon started Wednesday's trading session relatively weak but by late afternoon, the stock was spiking higher and attempting to fill an upper gap between the $98.67 and $99.79 range that was left behind on June 13.
- If Exxon closes the trading day near its high-of-day price, the stock will print a bullish Marubozu candlestick, which could indicate higher prices will come again on Thursday. If the stock closes the day at the opening price or near the low of day, Exxon will print a doji or shooting star candlestick, respectively, which could indicate the next high is in and lower prices are in the cards.
- Exxon is trading about 7% below the June 8 all-time high of $105.57. If the stock is able to bust up above the upper gap and consolidate there for a period of time, Exxon may be headed back for all time highs. If the stock is able to break up above the previous all-time high, a blue sky run could be on the horizon.
- Exxon has resistance above at $99.66 and $105.57 and support below at $96.62 and $92.53.