After Micron Technology Inc. (NASDAQ:MU) released weak fourth-quarter guidance, Advanced Micro Devices Inc. (NASDAQ:AMD) and Nvidia Corp. (NASDAQ:NVDA) slid more than 5% lower on Tuesday.
The lower prices Advanced Micro Devices and Nivida suffered were accelerated by a downturn in the general markets, which saw the S&P 500 retracing about 0.5% to the downside.
Despite AMD and Nvidia’s retracements lower, neither stock has yet negated their strong uptrends although both have come close.
An uptrend occurs when a stock consistently makes a series of higher highs and higher lows on the chart.
The higher highs indicate the bulls are in control while the intermittent higher lows indicate consolidation periods.
Traders can use moving averages to help identify an uptrend, with rising lower time frame moving averages (such as the eight-day or 21-day exponential moving averages) indicating the stock is in a steep shorter-term uptrend.
Rising longer-term moving averages (such as the 200-day simple moving average) indicate a long-term uptrend.
A stock often signals when the higher high is in by printing a reversal candlestick such as a doji, bearish engulfing or hanging man candlestick. Likewise, the higher low could be signaled when a doji, morning star or hammer candlestick is printed. Moreover, the higher highs and higher lows often take place at resistance and support levels.
In an uptrend, the "trend is your friend" until it’s not and in an uptrend there are ways for both bullish and bearish traders to participate in the stock:
- Bullish traders already holding a position in a stock can feel confident the uptrend will continue unless the stock makes a lower low. Traders looking to take a position in a stock trading in an uptrend can usually find the safest entry on the higher low.
- Bearish traders can enter the trade on the higher high and exit on the pullback. These traders can also enter when the uptrend breaks and the stock makes a lower low indicating a reversal into a downtrend may be in the cards.
Want direct analysis? Find me in the BZ Pro lounge! Click here for a free trial.
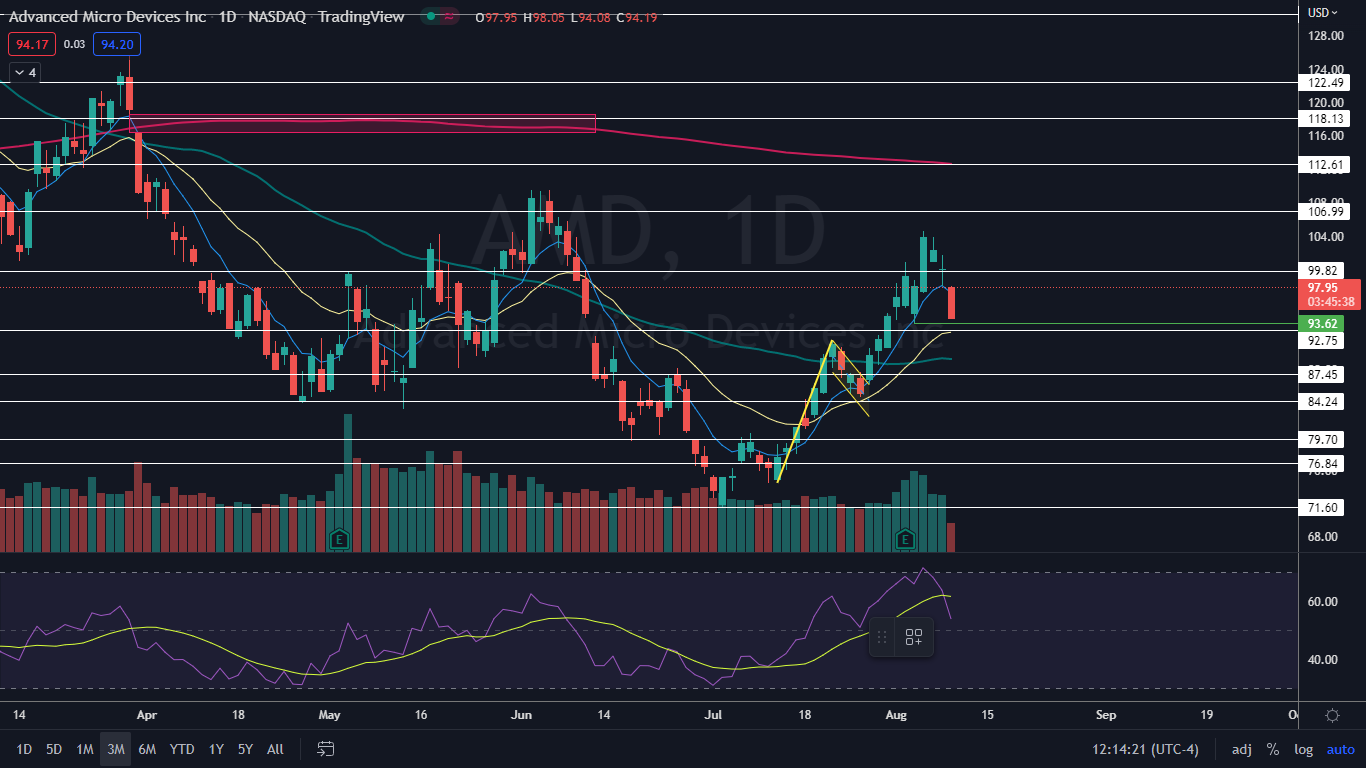
The Advanced Micro Devices Chart: Advanced Micro Devices’ most recent higher low in its uptrend was printed on Aug. 3 at $93.62 and the most recent higher high was formed at the $104.59 level the following day. The Santa Clara, California-based company will negate its uptrend if either the stock forms a lower low or rebounds up and tops out to form a lower high.
- If Advanced Micro Devices closes the trading day near its low-of-day price, the stock will print a bearish kicker candlestick, which could indicate lower prices will come again on Wednesday. If the stock bounces up to form a lower wick, Nvidia will print a hammer candlestick, which could indicate the next higher low has printed and higher prices are on the horizon.
- Advanced Micro Devices has resistance above at $99.82 and $106.99 and support below at $92.75 and $87.45.
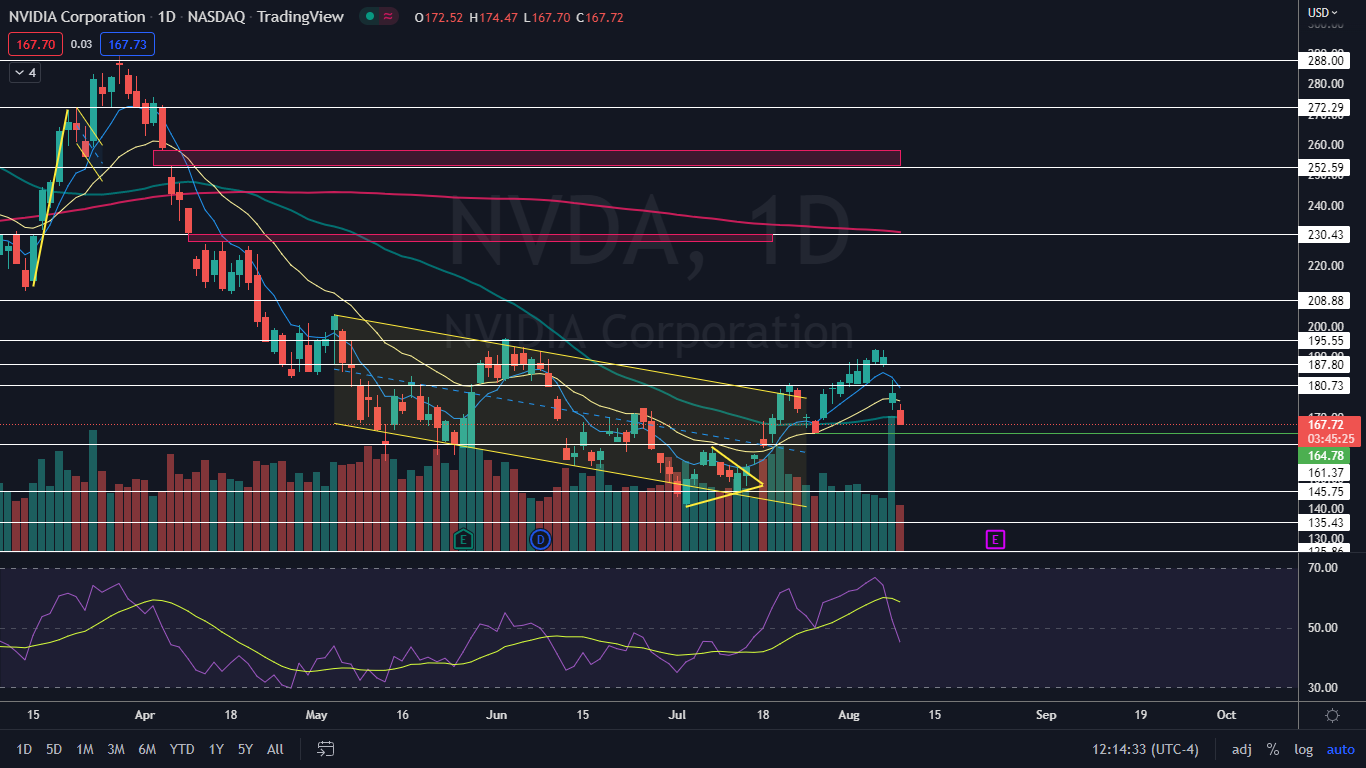
- If Nvidia closes the trading day near its low-of-day, a bearish Marubozu candlestick will print, suggesting lower prices are in the cards for Wednesday. Nvidia’s stock is in worse shape than AMD’s because on Tuesday the stock looked to be losing support at the 50-day simple moving average.
- Nvidia has resistance above at $180.73 and $187.80 and support below at $161.37 and $145.75.