Weber, Inc (NYSE:WEBR) was plunging about 12% at one point Tuesday after failing to hold above the 200-day simple moving average, despite the algorithms gapping the stock above the area to start the day.
The 200-day SMA is an important bellwether. Technical traders and investors consider a stock trading above the level on the daily chart to be in a bull cycle, whereas a stock trading under the 200-day SMA is considered to be in a bear cycle.
The 50-day SMA also plays an important role in technical analysis, especially when paired with the 200-day. When the 50-day SMA crosses below the 200-day SMA, a death cross occurs, whereas when the 50-day SMA crosses above the 200-day, a bullish golden cross takes place.
The 200-day SMA only became available on May 19, 200 trading days after the stock went public on Aug. 5, 2021. The 50-day SMA has been available since Oct. 14 and has never crossed above the 200-day.
Since Aug. 18, when Weber began to trade consistently near to the 200-day SMA, the 50-day SMA has risen slightly, trending about 25% below the 200-day as of Tuesday. If the stock can regain the 200-day SMA as support, the 50-day will eventually cross above the 200-day for the first time.
Want direct analysis? Find me in the BZ Pro lounge! Click here for a free trial.
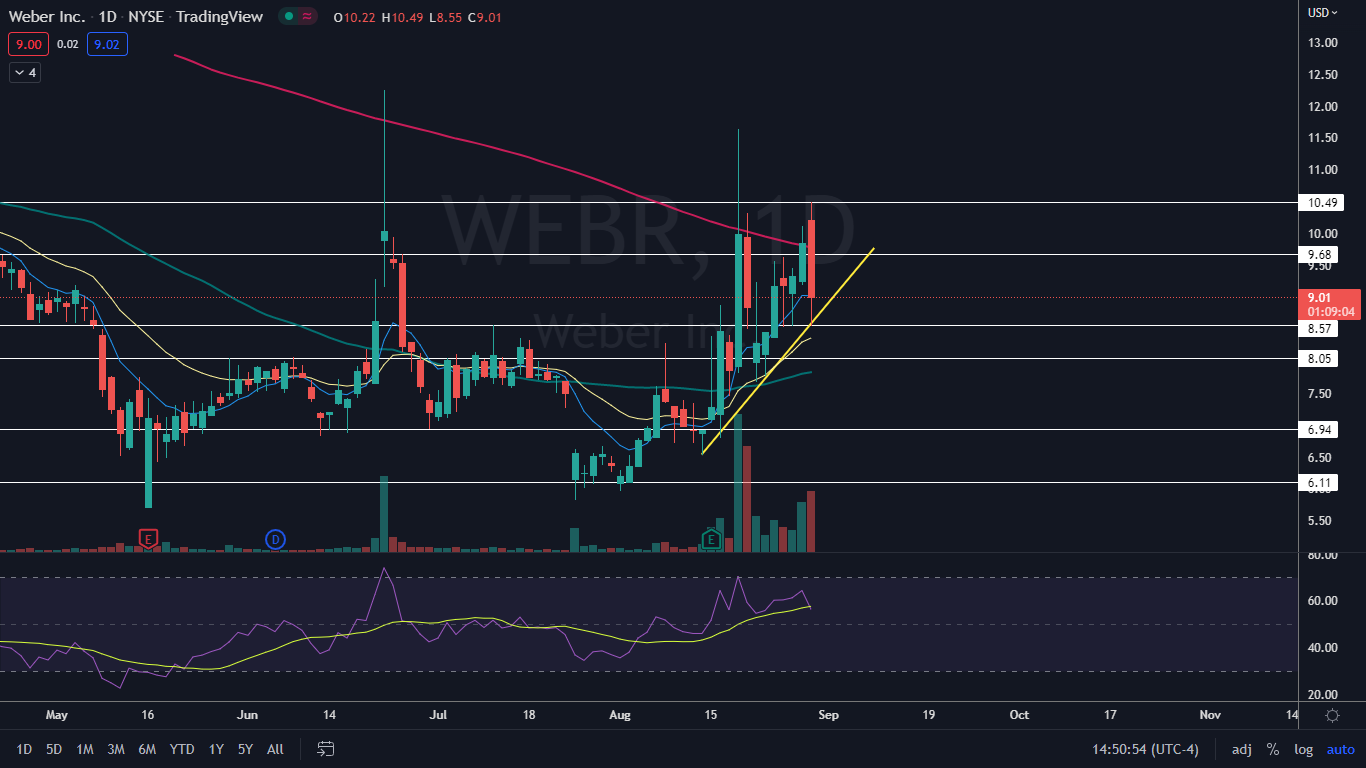
The Weber Chart: When Weber declined sharply on Tuesday, the stock found support near the $8.50 level, which also happened on Aug. 25 and Aug. 26. The price action across those three days has set Weber into a possibly bullish triple bottom pattern on the daily chart.
If the stock reacts to the triple bottom formation later this week, it may gain the strength to regain the 200-day SMA as support, which would give bullish traders more confidence going forward. In the meantime, traders want to see Weber hold above the eight-day exponential moving average, which may continue to guide the stock higher.
Weber may also be recognizing an ascending trendline, which the stock has been bouncing up from since Aug. 12. Although the trendline may continue to guide the stock higher, if Weber falls through the area on higher-than-average volume, it could indicate a reversal to the downside is in the cards.
Weber has resistance above at $9.68 and $10.49 and support below at $8.57 and $8.05.