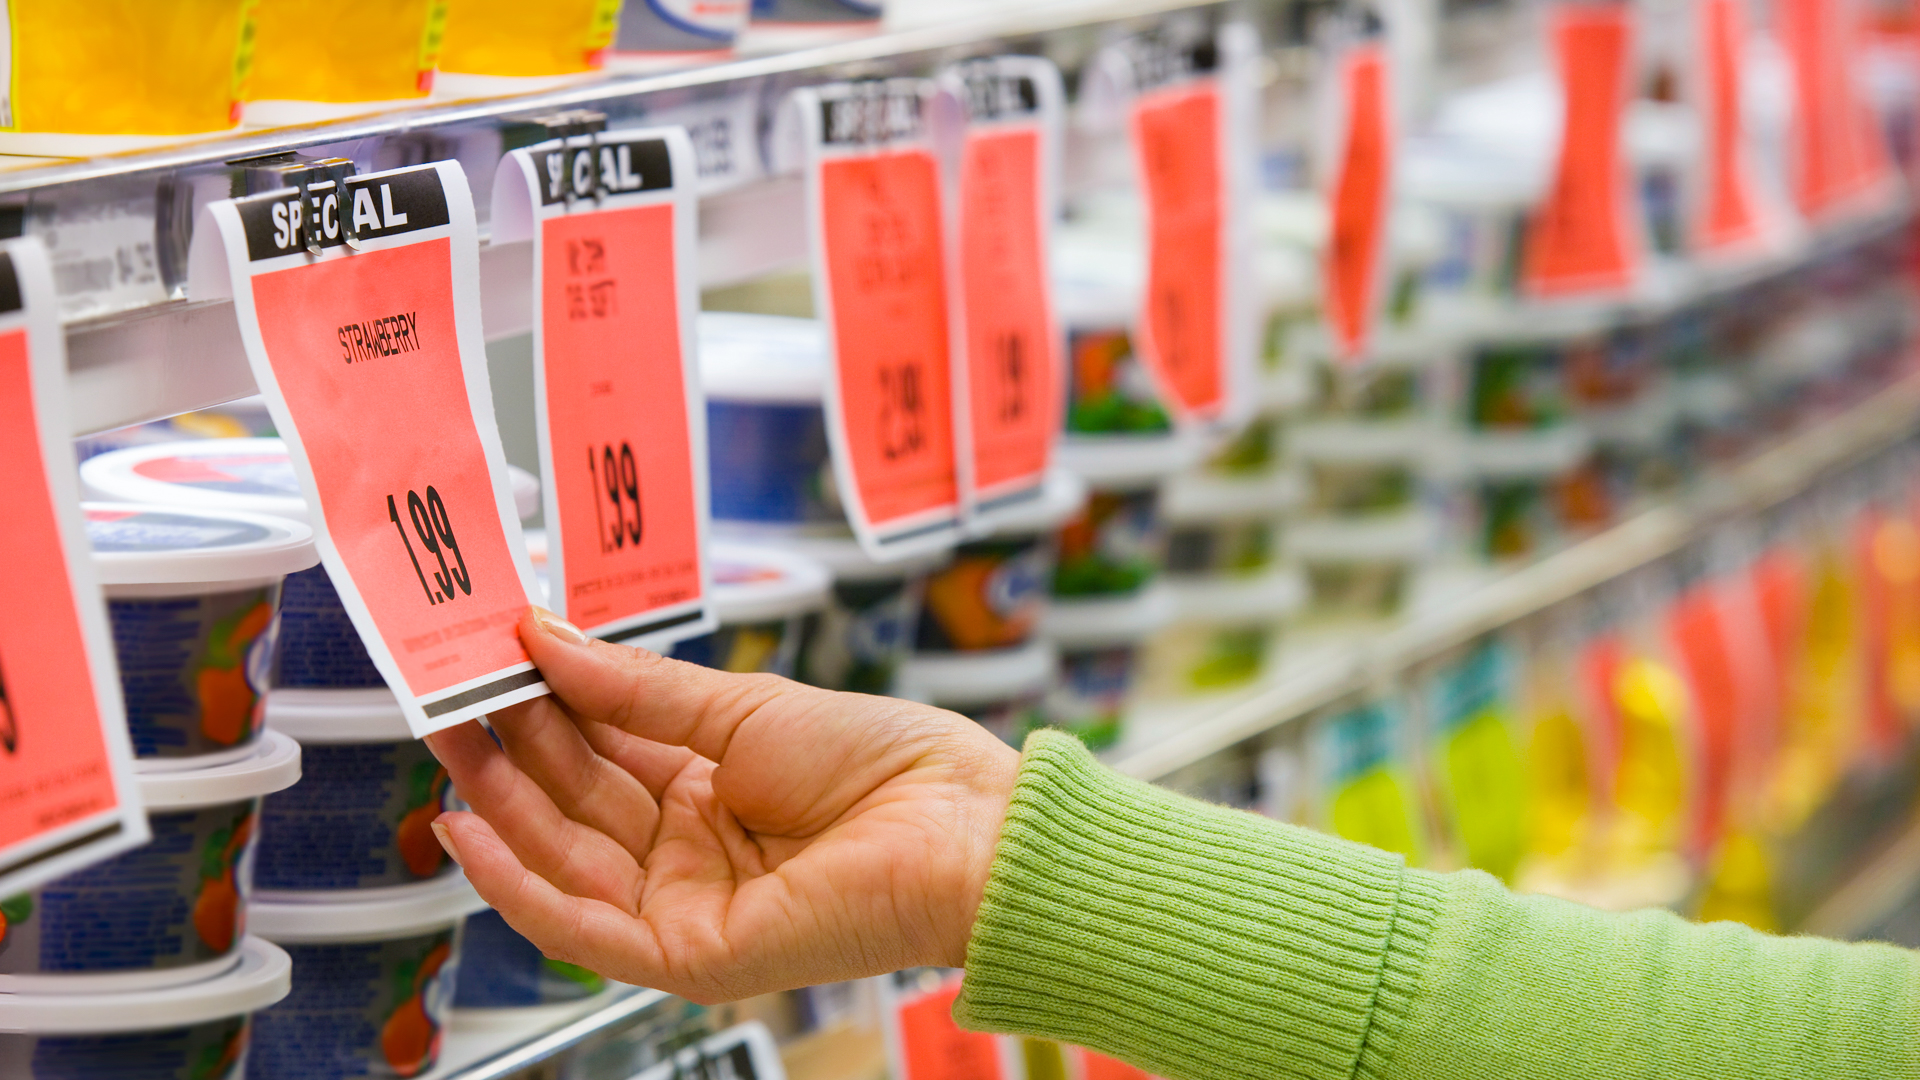
You might think states like Hawaii and California would have the most unaffordable grocery costs in the nation. However, new data from GOBankingRates reveals the most expensive states for groceries aren’t necessarily the states with the highest cost of living. Of the 10 costliest states, seven are in the Sun Belt.
Be Aware: I’m an Economist — Here’s How Likely a Recession Is for the Second Half of 2025
See More: 4 Housing Markets That Have Plummeted in Value Over the Past 5 Years
To find out which states have the most unaffordable grocery prices, GOBankingRates analyzed each state’s various food expenditures using the Bureau of Labor Statistics Consumer Expenditure Survey. Using the grocery cost-of-living index, the average grocery cost was calculated for each location along with the one-year change in dollar amount and percentages. From there, the percentage of median household income spent on total food at home costs was calculated. The states are organized from highest to lowest percent of household median income spent on food at home.

Key Findings
- Mississippi and West Virginia have the most unaffordable grocery costs in America. Grocery costs eat up 10% of your paycheck in these surprising two states.
- Seven of the 10 most expensive states for groceries are in the Sun Belt: Mississippi (#1), Arkansas (#3), Louisiana (#4), New Mexico (#6), Alabama (#7), Oklahoma (#8) and South Carolina (#10).
- Hawaii and California didn’t rank anywhere near the 10 most expensive states for grocery costs. Hawaii came in 22nd, with 8% of income going toward groceries, while California was 42nd at 6%.
- Grocery costs have increased the most in South Dakota over the last year. The one-year change is 12.56% from 2024 to 2025.
Here’s how much of your income goes toward groceries in every state.
Find Out: What Is the Estimated Median Income for the Upper-Middle Class in 2025?
Explore Next: Here’s the Minimum Net Worth To Be Considered Upper Class in Your 50s

1. Mississippi
- % of income going toward groceries: 10.57%
- 2025 average grocery cost: $5,805
- 2024 average grocery cost: $5,492
- 1-year percentage change: 5.70%
View More: What Salary Single People Need To Live Comfortably in 100 Major US Cities

2. West Virginia
- % of income going toward groceries: 10.11%
- 2025 average grocery cost: $5,853
- 2024 average grocery cost: $5,646
- 1-year percentage change: 3.67%

3. Arkansas
- % of income going toward groceries: 9.79%
- 2025 average grocery cost: $5,756
- 2024 average grocery cost: $5,429
- 1-year percentage change: 6.03%

4. Louisiana
- % of income going toward groceries: 9.75%
- 2025 average grocery cost: $5,853
- 2024 average grocery cost: $5,481
- 1-year percentage change: 6.80%

5. Kentucky
- % of income going toward groceries: 9.67%
- 2025 average grocery cost: $6,035
- 2024 average grocery cost: $5,692
- 1-year percentage change: 6.03%

6. New Mexico
- % of income going toward groceries: 9.54%
- 2025 average grocery cost: $5,926
- 2024 average grocery cost: $5,498
- 1-year percentage change: 7.79%
Discover Next: Here’s the Minimum Salary Required To Be Considered Upper-Middle Class in 2025

7. Alabama
- % of income going toward groceries: 9.52%
- 2025 average grocery cost: $5,908
- 2024 average grocery cost: $5,543
- 1-year percentage change: 6.57%

8. Oklahoma
- % of income going toward groceries: 9.11%
- 2025 average grocery cost: $5,793
- 2024 average grocery cost: $5,441
- 1-year percentage change: 6.47%

9. Montana
- % of income going toward groceries: 9.05%
- 2025 average grocery cost: $6,325
- 2024 average grocery cost: $5,777
- 1-year percentage change: 9.49%

10. South Carolina
- % of income going toward groceries: 8.96%
- 2025 average grocery cost: $5,986
- 2024 average grocery cost: $5,663
- 1-year percentage change: 5.71%

11. Florida
- % of income going toward groceries: 8.87%
- 2025 average grocery cost: $6,362
- 2024 average grocery cost: $6,000
- 1-year percentage change: 6.04%
Check Out: Salary Needed To Achieve the American Dream in the 50 Largest Cities

12. Alaska
- % of income going toward groceries: 8.83%
- 2025 average grocery cost: $7,887
- 2024 average grocery cost: $7,249
- 1-year percentage change: 8.81%

13. Tennessee
- % of income going toward groceries: 8.72%
- 2025 average grocery cost: $5,853
- 2024 average grocery cost: $5,538
- 1-year percentage change: 5.70%

14. Ohio
- % of income going toward groceries: 8.65%
- 2025 average grocery cost: $6,029
- 2024 average grocery cost: $5,640
- 1-year percentage change: 6.89%

15. South Dakota
- % of income going toward groceries: 8.64%
- 2025 average grocery cost: $6,259
- 2024 average grocery cost: $5,560
- 1-year percentage change: 12.56%

16. Missouri
- % of income going toward groceries: 8.49%
- 2025 average grocery cost: $5,853
- 2024 average grocery cost: $5,475
- 1-year percentage change: 6.91%
Try This: 9 Things the Middle Class Should Consider Downsizing To Save on Monthly Expenses

17. Indiana
- % of income going toward groceries: 8.47%
- 2025 average grocery cost: $5,932
- 2024 average grocery cost: $5,549
- 1-year percentage change: 6.90%

18. Idaho
- % of income going toward groceries: 8.47%
- 2025 average grocery cost: $6,319
- 2024 average grocery cost: $5,908
- 1-year percentage change: 6.96%

19. North Carolina
- % of income going toward groceries: 8.46%
- 2025 average grocery cost: $5,914
- 2024 average grocery cost: $5,612
- 1-year percentage change: 5.38%

20. Maine
- % of income going toward groceries: 8.46%
- 2025 average grocery cost: $6,071
- 2024 average grocery cost: $5,789
- 1-year percentage change: 4.88%

21. Michigan
- % of income going toward groceries: 8.41%
- 2025 average grocery cost: $5,986
- 2024 average grocery cost: $5,600
- 1-year percentage change: 6.89%
For You: How Much You Need To Earn To Be Upper Middle Class in Every State

22. Hawaii
- % of income going toward groceries: 8.29%
- 2025 average grocery cost: $8,147
- 2024 average grocery cost: $7,437
- 1-year percentage change: 9.56%

23. Vermont
- % of income going toward groceries: 8.25%
- 2025 average grocery cost: $6,440
- 2024 average grocery cost: $6,057
- 1-year percentage change: 6.34%

24. Wyoming
- % of income going toward groceries: 8.24%
- 2025 average grocery cost: $6,168
- 2024 average grocery cost: $5,720
- 1-year percentage change: 7.83%

25. Nevada
- % of income going toward groceries: 8.24%
- 2025 average grocery cost: $6,229
- 2024 average grocery cost: $5,885
- 1-year percentage change: 5.83%

26. Arizona
- % of income going toward groceries: 8.07%
- 2025 average grocery cost: $6,204
- 2024 average grocery cost: $5,766
- 1-year percentage change: 7.61%
Check Out: Here’s the Minimum Salary Required To Be Considered Upper Class in 2025

27. Kansas
- % of income going toward groceries: 8.04%
- 2025 average grocery cost: $5,841
- 2024 average grocery cost: $5,406
- 1-year percentage change: 8.04%

28. Nebraska
- % of income going toward groceries: 7.98%
- 2025 average grocery cost: $5,986
- 2024 average grocery cost: $5,657
- 1-year percentage change: 5.82%

29. Wisconsin
- % of income going toward groceries: 7.97%
- 2025 average grocery cost: $6,029
- 2024 average grocery cost: $5,589
- 1-year percentage change: 7.87%

30. Georgia
- % of income going toward groceries: 7.92%
- 2025 average grocery cost: $5,914
- 2024 average grocery cost: $5,549
- 1-year percentage change: 6.57%

31. Iowa
- % of income going toward groceries: 7.92%
- 2025 average grocery cost: $5,793
- 2024 average grocery cost: $5,509
- 1-year percentage change: 5.15%

32. Oregon
- % of income going toward groceries: 7.91%
- 2025 average grocery cost: $6,362
- 2024 average grocery cost: $6,057
- 1-year percentage change: 5.04%

33. Pennsylvania
- % of income going toward groceries: 7.75%
- 2025 average grocery cost: $5,896
- 2024 average grocery cost: $5,657
- 1-year percentage change: 4.21%

34. North Dakota
- % of income going toward groceries: 7.75%
- 2025 average grocery cost: $5,884
- 2024 average grocery cost: $5,418
- 1-year percentage change: 8.60%

35. Texas
- % of income going toward groceries: 7.60%
- 2025 average grocery cost: $5,799
- 2024 average grocery cost: $5,481
- 1-year percentage change: 5.81%

36. New York
- % of income going toward groceries: 7.45%
- 2025 average grocery cost: $6,301
- 2024 average grocery cost: $5,925
- 1-year percentage change: 6.34%
Trending Now: Mark Cuban Tells Americans To Stock Up on Consumables as Trump’s Tariffs Hit — Here’s What To Buy

37. Delaware
- % of income going toward groceries: 7.31%
- 2025 average grocery cost: $6,059
- 2024 average grocery cost: $5,846
- 1-year percentage change: 3.65%

38. Illinois
- % of income going toward groceries: 7.30%
- 2025 average grocery cost: $5,962
- 2024 average grocery cost: $5,595
- 1-year percentage change: 6.57%

39. Minnesota
- % of income going toward groceries: 6.96%
- 2025 average grocery cost: $6,095
- 2024 average grocery cost: $5,823
- 1-year percentage change: 4.68%

40. Rhode Island
- % of income going toward groceries: 6.94%
- 2025 average grocery cost: $5,992
- 2024 average grocery cost: $5,811
- 1-year percentage change: 3.12%

41. Washington
- % of income going toward groceries: 6.90%
- 2025 average grocery cost: $6,549
- 2024 average grocery cost: $6,022
- 1-year percentage change: 8.75%
View Next: The Living Wage a Family of 4 Needs in All 50 States

42. California
- % of income going toward groceries: 6.84%
- 2025 average grocery cost: $6,586
- 2024 average grocery cost: $6,370
- 1-year percentage change: 3.38%

43. Colorado
- % of income going toward groceries: 6.72%
- 2025 average grocery cost: $6,210
- 2024 average grocery cost: $5,743
- 1-year percentage change: 8.14%

44. Virginia
- % of income going toward groceries: 6.58%
- 2025 average grocery cost: $5,986
- 2024 average grocery cost: $5,680
- 1-year percentage change: 5.39%

45. Connecticut
- % of income going toward groceries: 6.55%
- 2025 average grocery cost: $6,144
- 2024 average grocery cost: $5,851
- 1-year percentage change: 5.00%

46. Utah
- % of income going toward groceries: 6.47%
- 2025 average grocery cost: $5,938
- 2024 average grocery cost: $5,572
- 1-year percentage change: 6.57%
Find Out: What Is the Estimated Median Income for the Upper-Middle Class in 2025?

47. Maryland
- % of income going toward groceries: 6.26%
- 2025 average grocery cost: $6,362
- 2024 average grocery cost: $6,108
- 1-year percentage change: 4.16%

48. New Hampshire
- % of income going toward groceries: 6.25%
- 2025 average grocery cost: $5,980
- 2024 average grocery cost: $5,697
- 1-year percentage change: 4.97%

49. New Jersey
- % of income going toward groceries: 6.15%
- 2025 average grocery cost: $6,210
- 2024 average grocery cost: $5,943
- 1-year percentage change: 4.51%

50. Massachusetts
- % of income going toward groceries: 6.13%
- 2025 average grocery cost: $6,216
- 2024 average grocery cost: $5,954
- 1-year percentage change: 4.41%
Methodology: The breakdown of food expenditures was found using the Bureau of Labor Statistics Consumer Expenditure Survey and, using the grocery cost-of-living index, the average grocery cost was calculated for each location. The 1-year change in dollar amount and percentages was calculated. The percentage of median household income that is spent on the total food at home costs was calculated and the states were sorted to show the highest to lowest percent of household median income that is spent on food at home. All data was collected on and is up to date as of July 8, 2025.
More From GOBankingRates
This article originally appeared on GOBankingRates.com: Here’s How Much More You Are Paying for Groceries in Your State


