
What a messy couple of days in the investment world.
Investors have been spooked by the bank failures, and as a result, some asset prices have seen tremendous volatility. Among them has been gold.
At last check, spot gold prices were up $42 an ounce, or 2.5%. Those gains added to Friday’s rally, where gold rallied $32.60 an ounce or almost 1.8%.
For now, gold is riding a three-day win streak, up 5.5% from Thursday’s low.
Don't Miss: Crisis in Regional Banks Brews. Here's What a Key Chart Says Now.
The failure of SVB Financial (SIVB) has spread, taking down Signature Bank (SBNY) over the weekend, while shares of First Republic Bank (FRC) are getting swamped on Monday, down as much as 78%.
These failures are sparking concern and confusion on Wall Street.
For instance, the CBOE Volatility Index, known as the VIX, climbed more than 53% from Thursday’s low to Friday’s high. On Monday, the VIX — also known as the fear gauge — temporarily took out Friday’s high. At the session high, it was up 28% on the day.
In other words, investors are fleeing into so-called safe-haven assets like Treasury securities and gold. Let’s take a closer look at the yellow metal.
Trading Gold
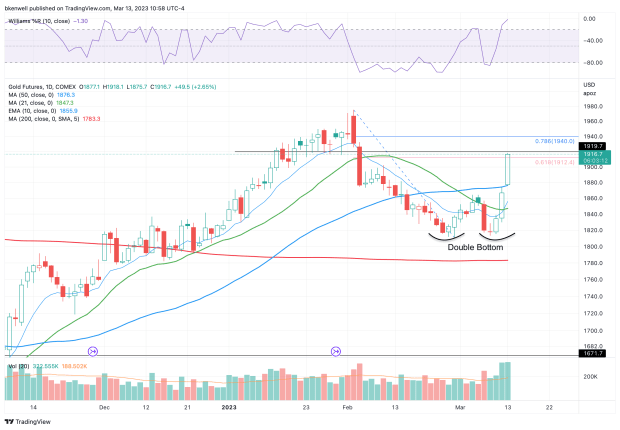
Chart courtesy of TradingView.com
Gold found solid support near $1,815, put in a double bottom and has since turned higher. Amid the rally, gold has reclaimed the 10-day, 21-day and 50-day moving averages.
It now faces a critical area on the chart.
That’s as it runs into the 61.8% retracement near $1,912, as well as the $1,920 level, which was strong support in late January before ultimately failing. It brings up the question: Can this level be reclaimed or will former support turn into current resistance?
If it’s resistance, the bulls would like to see gold prices stay above the moving averages outlined above (the 10-day, 21-day and 50-day).
If, however, gold prices can break through $1,920, the door opens to the 78.6% retracement at $1,940, then the recent high up at $1,975. Above $1,975 and the more obvious target of $2,000 is in play.
Trading the GLD ETF
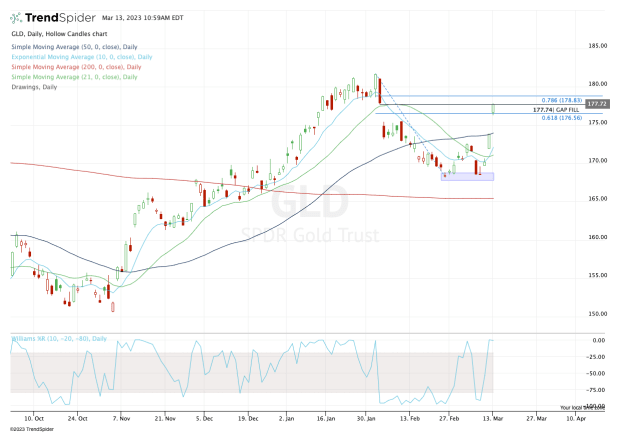
Chart courtesy of TrendSpider.com
The SPDR Gold Trust (GLD) is also rallying, pushing through the 61.8% retracement this morning and hitting the gap-fill level near $177.75.
If the rally continues, let’s see if the GLD ETF can hit the 78.6% retracement near $178.80. Above that opens the door back to the recent highs near $181.
On the downside, keep an eye on Monday’s low at $176.30. A break of this mark could open the door back down to the gap-fill level near $174.
That level comes into play near the 50-day moving average and above the 10-day and 21-day moving averages. Ideally, bulls will want to see the GLD ETF hold these levels if it does go on to fill the gap near $174 sometime in the next few days or weeks.