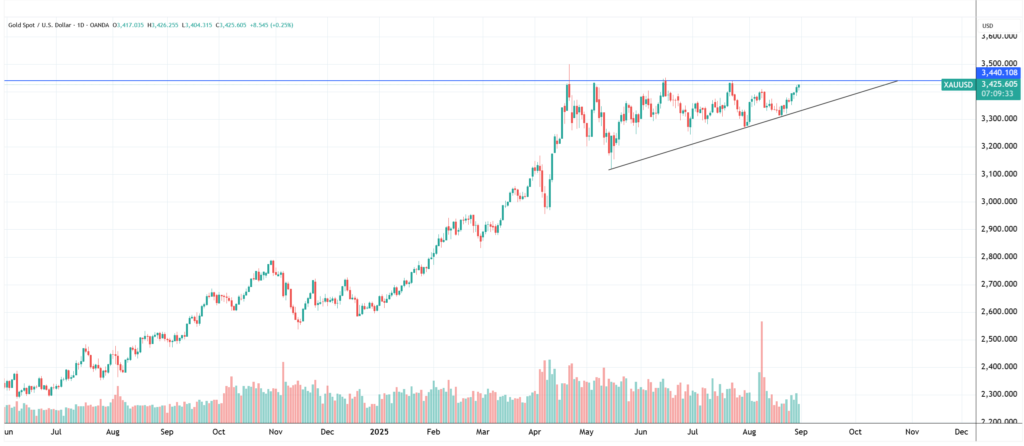
After surging to an all-time high of $3,500 per ounce in April, gold has cooled off, building a narrow base between $3,200 and $3,400. Rather than signaling exhaustion, this consolidation has formed an ascending triangle, a pattern that often precedes an upside breakout.
If that structure unfolds, gold could be on track for a decisive move to new highs, potentially opening the door to levels that traders have not seen before.
Not Waiting For The Fed
Much of the focus in financial markets naturally centers on the Federal Reserve and its Chairman, Jerome Powell. But gold doesn't appear to be waiting for the Fed's following announcement; it is already building on Powell's Jackson Hole dovish remarks, leaning into what markets believe is coming.
Traders might not be just pricing in a September rate cut but starting to anticipate a policy path shaped not only by Powell, but possibly by his successor. Markets, after all, move on expectation rather than confirmation.
Meanwhile, President Donald Trump is doing Donald Trump things—throwing curveballs at the Fed and hinting that the White House should have more say in monetary policy. For investors, the prospect of political influence creeping into monetary policy is unsettling. When credibility is on the line, gold benefits.
Foreign Banks Go Yellow
For the first time since 1996, foreign central banks hold more gold than U.S. Treasuries as a share of their reserves. That shift reflects concerns about debt sustainability, the risks embedded in U.S. assets, and the desire for a neutral reserve anchor in a fragmented world. This steady official-sector demand has created a supportive floor for prices, regardless of short-term moves in interest rates or the dollar.
Geopolitical pressures only reinforce this trend. From energy markets to trade disputes, uncertainty has led investors to lean toward hard assets. In that sense, gold is not waiting for a single Fed signal—it is already digesting a mix of political risk, reserve reallocation, and the shifting global monetary order.
Technically Speaking
On the charts, the story is equally compelling. Since its peak, gold has been etching a series of higher lows against a flat ceiling near $3,430–$3,450. That's the classic definition of an ascending triangle: patient buyers stepping in sooner, while resistance holds steady. These setups typically break higher, as the pressure builds until sellers run out of strength.

Spot Gold 1-year daily chart, Source: TradingView
The measurement of this pattern indicates a target of approximately $3,800. The math is straightforward. The triangle's height is about $360, and adding that to the breakout level (~$3,430) gives the projection.
In the short term, the focus is on whether gold can decisively clear $3,450 and retest the $3,500 ceiling. In the medium term, if the breakout holds, the $3,800 area becomes the next logical target. As usual, breakout volume should provide clues to savvy investors.
However, regardless of whether the breakout is genuine or a fakeout, the move could be sudden, sharp, and without a defined fundamental catalyst.
Price Watch: SPDR Gold Trust ETF (NYSE:GLD) is up 30.74% year-to-date.
Read Next:
Image: Shutterstock


