
Greater-than-expected revenue for the third quarter propels Getty Realty Corp. (NYSE:GTY) to a higher price.
Most REITs are just now bouncing off recent 52-week lows, but buyers have been piling into Getty since late September.
Wall Street likes that third-quarter revenue was $41.97 million, up from the $40.10 million reported in the second quarter. Funds from operations came in at $0.54 per share compared to the $0.50 per share from the previous quarter.
The company achieves most of its revenue from rental income, with much of that coming from convenience store properties, car washes, automotive parts retailers and certain drive-through restaurants.
Getty trades with a price-earnings ratio of 23 and at just about twice its book value. The REIT pays a 5.46% dividend, an attractive rate for a company showing increased revenues and funds from operations.
It’s a smallish real estate investment trust (REIT) compared to the majors in the sector: Getty’s market capitalization of $1.5 billion is tiny when you consider that American Tower Corp. (NYSE:AMT), for example, has a market cap of $95.3 billion. Average daily volume for Getty is a mere 226,000 shares.
In late August, Bank of America Securities upgraded its opinion of Getty from underperform to neutral with a price target of $33.
The daily price chart for Getty looks like this:
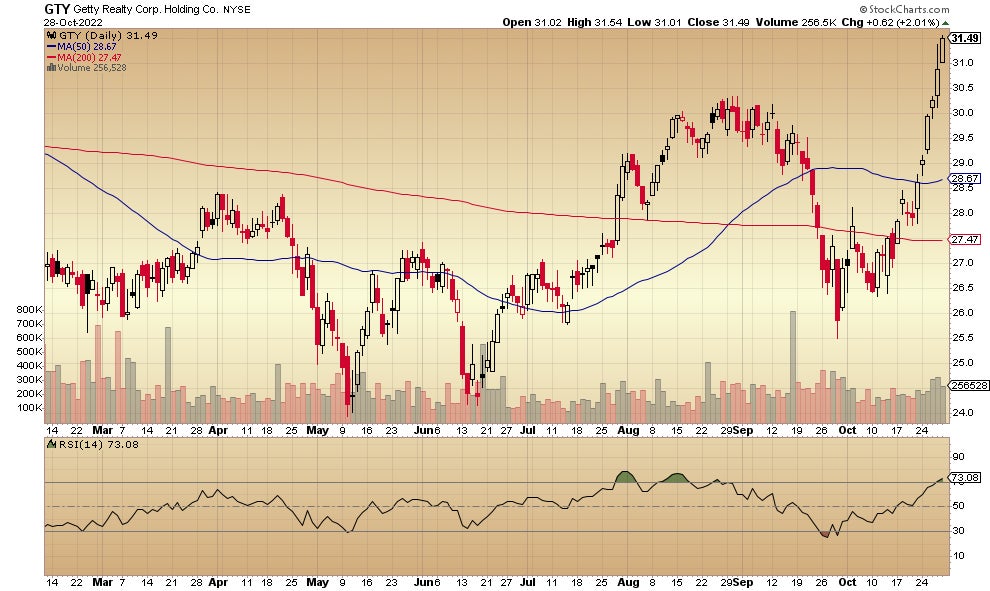
This is a much different look than most other real estate investment trusts right now as the price is rallying to new 52-week highs. The breakout above the late August highs is obvious, and note that Getty now is trading well above both the 50-day and 200-day moving averages, typically considered a bullish configuration.
The weekly chart is here:
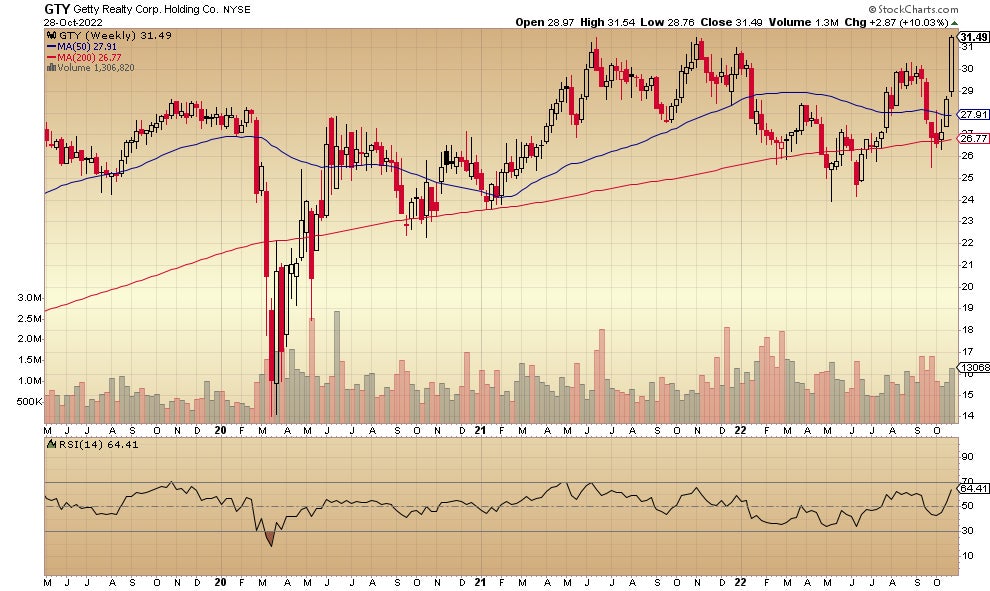
Not only did Getty make it higher than the August highs, but the REIT is also now trading above the 2021 high of $31. Take a look at the steady upward movement of the 200-week moving average. Again, this is not something seen too much these days on most real estate investment trust price charts.
See more real estate news and insights from Benzinga
- This Little-Known REIT Is Producing Double-Digit Returns In A Bear Market: How?
- New Investment Platform Lets You Become A Landlord With $100
- You Can Now Invest In An Entire City’s Residential Real Estate Market
Not investment advice. For educational purposes only.
Charts courtesy of StockCharts