It’s not surprising that General Electric (GE) stock has been under pressure over the past few days and that's before we take into account the recent stock market volatility.
In late January, GE stock suffered a large spill, trading lower on earnings. Guidance was an issue and so was the fourth-quarter revenue miss.
However, the decline gave bulls an excellent dip-buying opportunity. Shares bottomed over a three-day stretch, wicking off the $88 area each day before turning higher and rallying back over $100.
Then last week, the company clarified its outlook due to supply chain issues, which again weighed on the stock with shares falling almost 6% that day.
Given the action both in General Electric’s business and in the overall market, it’s a surprise that the stock is not lower.
That brings up the chart, which shows some interesting support levels to keep an eye on.
Trading GE Stock
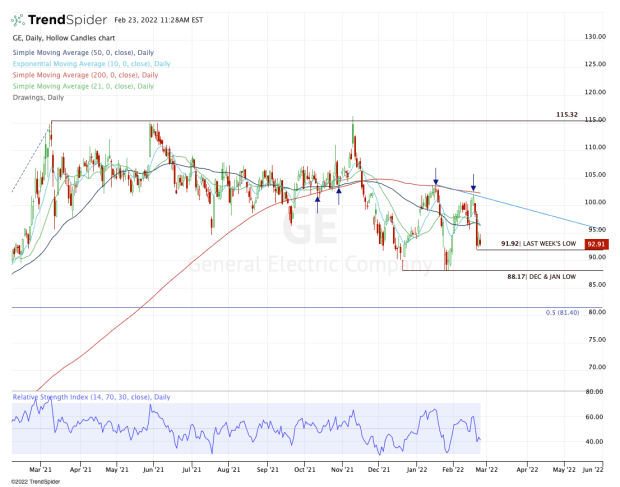
Chart courtesy of TrendSpider.com
In December, GE stock bottomed at $88.17 and had a robust upside bounce. However, notice the change in character we saw at the 200-day moving average.
This moving average was support in the third and fourth quarters before failing in November. Then when General Electric was rallying in early January, this measure was resistance.
The change in character is being noted as: Selling the rips rather than buying the dips and prior support turning into current resistance.
We’re currently looking at back-to-back inside days, with an inside day meaning that the day’s range is completely contained within the prior day’s range.
If the stock breaks below the prior day’s low and can’t quickly reclaim it, that could lead to an inside-and-down day, (which is just breaking the prior day’s low following an inside day).
In any event, the larger downside rotation potential sits with last week’s low of $91.92. A break of this level and failure to reclaim it puts GE stock in a weekly-down rotation.
In that case, the must-hold support level that’s referenced in the story’s headline is at $88.
That’s where the stock bounced from in December and it’s the post-earnings support zone from January.
To break below $88 opens the door to more downside, particularly if the overall market can’t find its footing. In that scenario, it could put the 50% retracement in play down near $81.50.
On the upside, a move over $95 puts the 10-day, 21-day and 50-day moving averages in play. Look to see if these moving averages are active resistance. Above them puts downtrend resistance in play (blue line), followed by the 200-day.