One of the cynical joys of earnings season is the chance to pick up stocks trading at basement-level valuations. It’s almost a certainty that at least a few companies will either deliver a stinker or otherwise severely disappoint shareholders in some manner. Electronics device manufacturer Garmin (GRMN) recently experienced the latter situation.
On paper, Garmin would seem to be on a pathway to capital gains. According to an AP report, the company posted net income of $2.07 per share. Adjusted for non-recurring line items, earnings per share hit $2.17, beating the consensus EPS estimate of $1.96. On the top line, the device maker generated sales of $1.81 billion, jumping above the Street’s view of $1.74 billion.
Despite the results, GRMN stock dropped more than 7%. It raises the obvious question: what the heck happened?
The likely culprit may be the forward guidance. Management anticipates full-year earnings to land at $8 per share, with revenue reaching $7.1 billion. These metrics also exceeded what analysts were targeting. However, it appears that the guidance is signaling a weaker performance in the second half. With investors already jittery due to macroeconomic concerns, they decided to jump ship.
What’s adding to the pressure is the smart money. On Wednesday, options flow — which focuses exclusively on big block transactions likely placed by institutional investors — showed that net trade sentiment fell sharply to $90,400 below parity.
Total gross bearish volume was $96,200, whereas gross bullish volume was only $5,800. Very few market participants were willing to stick their necks out for GRMN stock. While this might seem sensible, contrarian traders may have an opportunity for deep value.
Taking a Closer Look at the Discount in GRMN Stock
Following a huge bout of volatility, it’s not uncommon for financial analysts to label the crimson-stained security as attractively priced or deeply discounted. It’s an understandable argument because, based on our lived experience, securities suffering a downfall tend to overcorrect before reaching an equilibrium. But the analysis risks becoming a presuppositional fallacy since it would be assuming that the prior pricing was correct — hence why the current price is attractive.
The problem isn’t so much that the analyst is deliberately presupposing that which is yet to be proven. Rather, the issue is largely structural. Common financial metrics such as share prices or earnings are continuous scalar signals. Even worse for analysts, they’re unbounded. Theoretically, GRMN stock could rise indefinitely. That means there’s no objective mechanism to determine what a “good price” is — it’s very much a relative term.
Is there an objective way to better determine the existence of good value? In my opinion, the only way to extract this assessment is to consider the equity arena’s objective truth: at the end of the day, the market is either a net buyer or net seller.
Looking at the last 10 weeks, the truth about GRMN stock is that the market voted to buy the security six times and sell four times. During this period, GRMN saw an upward trajectory. For brevity, we can label this sequence as “6-4-U.”
At first glance, it might sound stupid to compress the magnitude dynamism of GRMN stock into a simple binary code. But what we have done is to create an empirical behavioral profile — a profile that is quantifiable and falsifiable. Through the use of past analogs, we can then determine how the market historically responds to the 6-4-U sequence.
Even better, we can discretize the entire price action of GRMN stock (going back to January 2019) across rolling 10-week intervals. This creates a demand profile by which we can build a decision-tree logic:
L10 Category |
Sample Size |
Up Probability |
Baseline Probability |
Median Return if Up |
2-8-D |
12 |
41.67% |
57.14% |
5.58% |
3-7-D |
15 |
40.00% |
57.14% |
5.30% |
4-6-D |
29 |
68.97% |
57.14% |
1.82% |
5-5-D |
38 |
44.74% |
57.14% |
2.33% |
5-5-U |
33 |
54.55% |
57.14% |
1.91% |
6-4-D |
12 |
66.67% |
57.14% |
4.85% |
6-4-U |
80 |
62.50% |
57.14% |
1.81% |
7-3-U |
56 |
50.00% |
57.14% |
1.61% |
8-2-U |
14 |
57.14% |
57.14% |
1.60% |
9-1-U |
13 |
69.23% |
57.14% |
1.70% |
From the table above, we know that the chance of a long position in GRMN stock being profitable on any given week is 57.14%. This is effectively our null hypothesis, the assumption of no mispricing. However, our alternative hypothesis is that because of the 6-4-U sequence, the chance of upside theoretically improves to 62.5%.
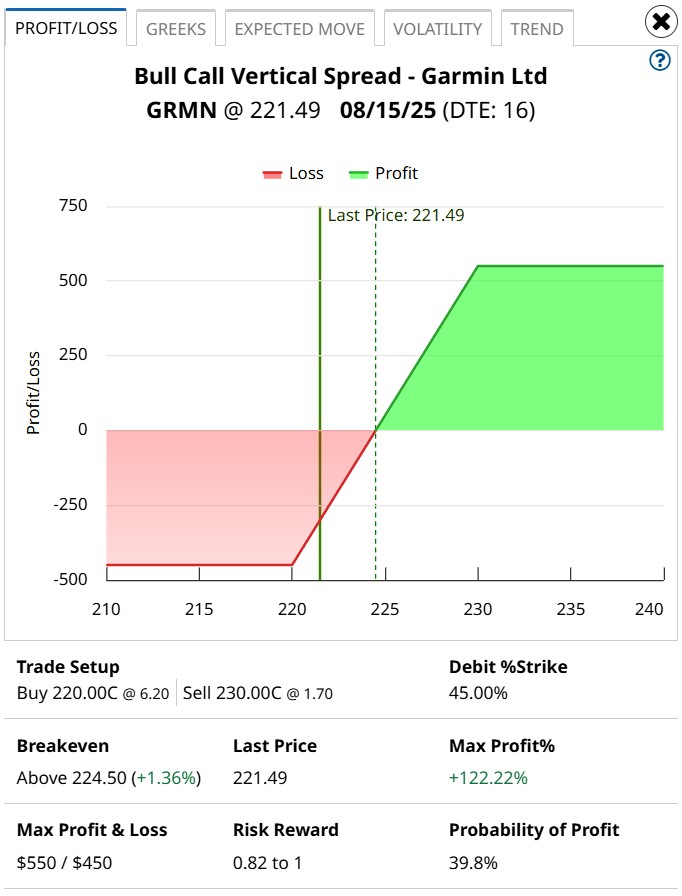
Assuming the positive pathway, the median expected return is 1.81%. If the bulls manage to maintain control for a second week, the expected upside is an additional performance boost of 0.67%. With GRMN stock closing at $221.49, it’s possibly on a course to hit $227.
The thing is, a single-day loss of over 7% is quite rare for Garmin. It’s not unreasonable, then, to believe that a resultant bounce back (if it materializes) would be stronger than usual.
Putting the Numbers Together
From the market intelligence above, intrepid traders may consider the 220/230 bull call spread expiring Aug. 15. This transaction involves buying the $220 call and simultaneously selling the $230 call, for a net debit paid of $450 (the most that can be lost in the trade). Should GRMN stock rise through the short strike price ($230) at expiration, the maximum profit is $550, a payout of over 122%.
Investors intrigued by this trade will depend heavily on the implications of the 6-4-U sequence. Running a one-tailed binomial test reveals a p-value of 0.1885. This means that there’s an 18.85% chance that the implications of the sequence can materialize randomly as opposed to intentionally. This doesn’t meet the threshold of statistical significance. However, given the market’s open and entropic system, there could be something interesting here.
There are only a handful of post-earnings blunders that are empirically intriguing using the above framework. Garmin is one of them. At the very least, GRMN stock should be on your speculative radar.
On the date of publication, Josh Enomoto did not have (either directly or indirectly) positions in any of the securities mentioned in this article. All information and data in this article is solely for informational purposes. For more information please view the Barchart Disclosure Policy here.