
The theme of this year’s G20 is growth, apparently, with members aiming to raise the level of growth in G20 output by at least 2% over the next five years. So which countries’ economies are growing, and which are slowing down? The University of Melbourne’s G20Watch site has compiled figures for a number of different statistics for each member nation (excluding the EU). Here’s GDP growth since the global financial crisis:
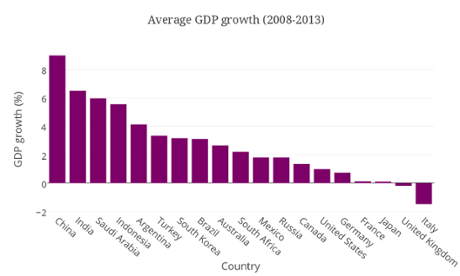
India, China and other Asian countries are powering ahead, with western nations towards the lower end of the chart.
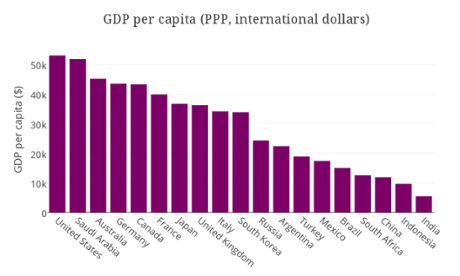
Looking at GDP per capita, which takes into account the country’s wealth and population, the rankings are largely reversed:
Although the Australian government has refused calls to add climate change to the G20 agenda, it has reluctantly agreed to add a reference to climate change in the final G20 leaders’ communique after heavy lobbying from the US and EU. Here are the emissions figures for the G20 countries:
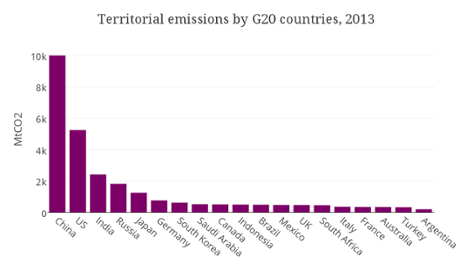
Territorial emissions counts emissions from within the country, and doesn’t consider those produced from its imports. China tops the list for the total number of million tonnes of carbon dioxide, but moves towards the middle when considering emissions per person:
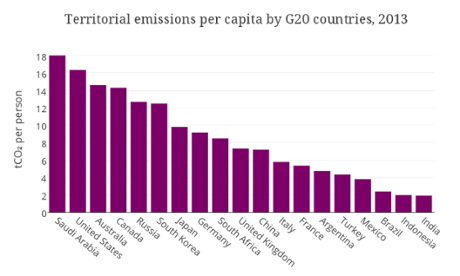
The US remains towards the top for both, and Saudi Arabia and Australia both punch above their weight with the per person emissions figures.
Here are the rest of the figures, including data on population and trade, compiled by G20 Watch.