
Ford Motor Company (NYSE:F) shares are trading higher Wednesday after the company announced the separation of its electric vehicle and internal combustion engine businesses.
The company reported February 2022 total U.S. sales of 129,273 vehicles, representing a year-over-year decrease of 20.9%. The company also announced the separation of its electric vehicle and internal combustion engine businesses. The new branches of the company will be named “Ford Blue” and “Ford Model e.”
Ford was up 8.71% at $18.16 Wednesday afternoon at publication.
See Also: Why Ford Shares Are Trading Higher Today
Ford Daily Chart Analysis
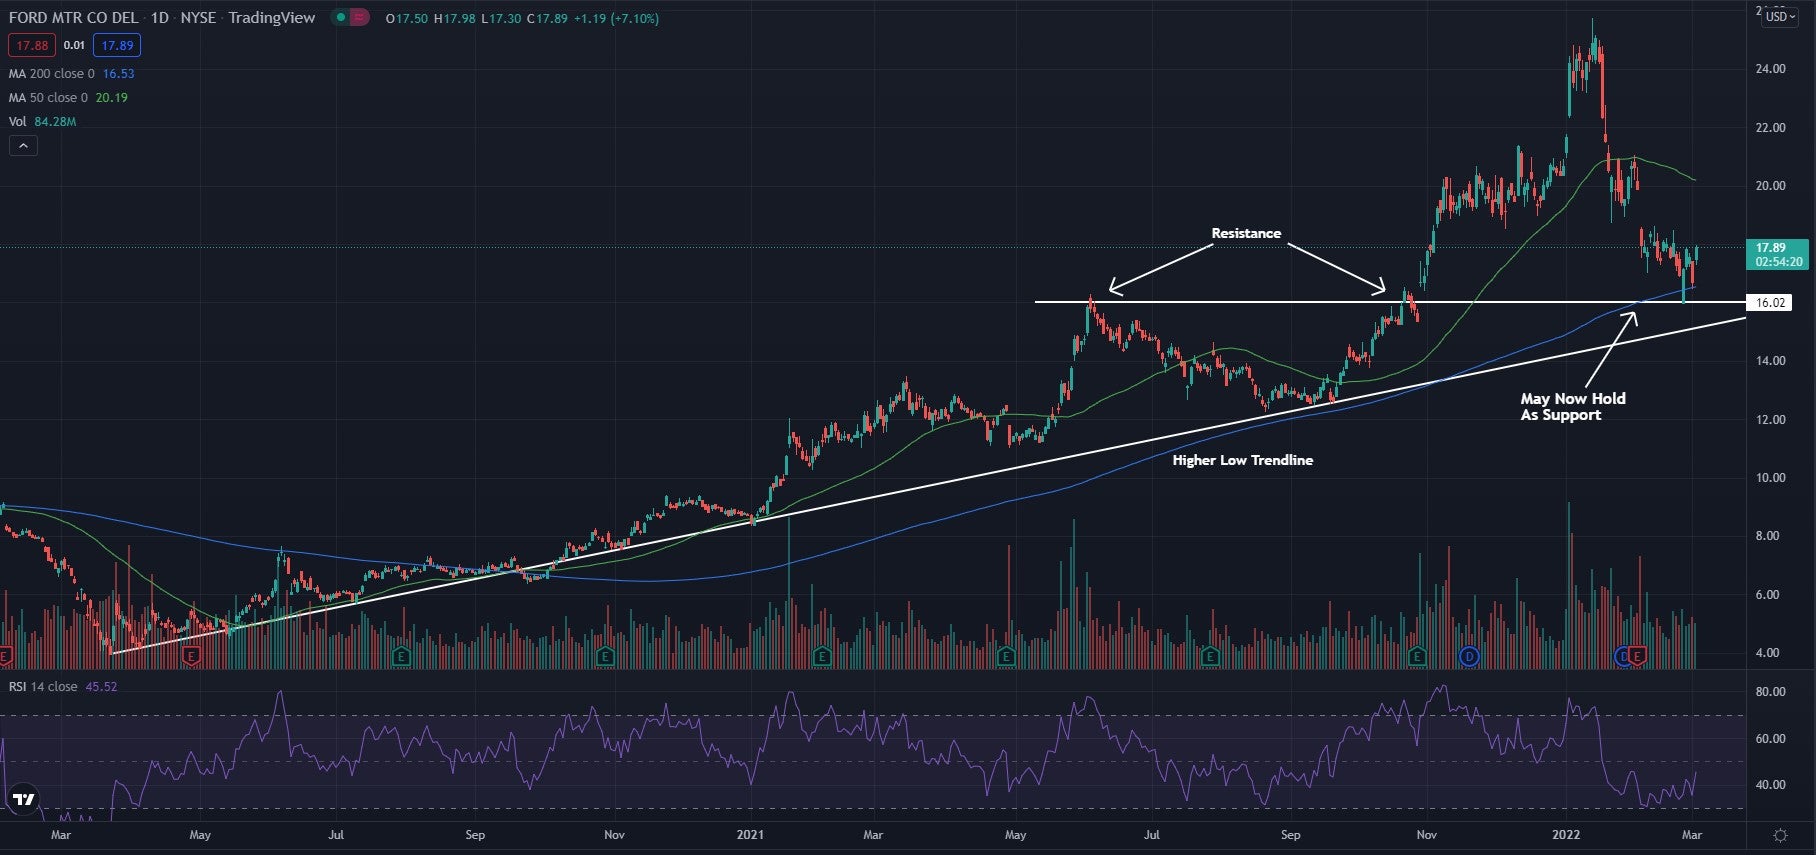
- The stock has fallen back to the resistance level of an ascending triangle it once traded in and was able to hold the old resistance as an area of support. After bouncing off the $16 level, the stock has been pushing higher once again. If the bullish momentum continues, the stock will continue on the uptrend it has been on.
- The stock trades below the 50-day moving average (green) but trades above the 200-day moving average (blue), indicating the stock is in a period of consolidation. The 50-day moving average may act as a place of resistance, while the 200-day moving averages may hold as support.
- The Relative Strength Index (RSI) has been slowly climbing again for the past couple of weeks and has reached 44 on the indicator. This shows that more buyers have been moving into the stock once again though the selling pressure still remains greater overall. If the RSI continues to rise, the price may continue to push higher along the upward trend.
What’s Next For Ford?
After seeing a large spike, Ford stock needed to cool off for a bit. The stock pushed parabolically upward and then came right back down. The bearish momentum continued for a bit and the stock fell back to the old resistance level of $16. This time the stock was able to hold the level as support and saw a bounce. Bullish traders are now looking to see the stock form higher lows after bouncing and continue the upward trend the stock was previously on. Bearish traders would like the RSI to be unable to cross back above the middle line and stay low. Bears then are looking for a drop below the $16 level and the higher low trendline for a possible bearish trend to start.
Photo: Courtesy Ford