Ford Motor Company (NYSE:F) was trading higher Monday, as the stock continued to trend northward in an uptrend pattern.
An uptrend occurs when a stock consistently makes a series of higher highs and higher lows on the chart.
The higher highs indicate the bulls are in control while the intermittent higher lows indicate consolidation periods. Traders can use moving averages to help identify an uptrend with rising lower timeframe moving averages (such as the eight-day or 21-day exponential moving averages) indicating the stock is in a steep shorter-term uptrend and rising longer-term moving averages (such as the 200-day simple moving average) indicating a long-term uptrend.
A stock often signals when the higher high is in by printing a reversal candlestick such as a doji, bearish engulfing or hanging man candlestick. Likewise, the higher low could be signaled when a doji, morning star or hammer candlestick is printed. Moreover, the higher highs and higher lows often take place at resistance and support levels.
In an uptrend the "trend is your friend" until it’s not and in an uptrend there are ways for both bullish and bearish traders to participate in the stock:
- Bullish traders who are already holding a position in a stock can feel confident the uptrend will continue unless the stock makes a lower low. Traders looking to take a position in a stock trading in an uptrend can usually find the safest entry on the higher low.
- Bearish traders can enter the trade on the higher high and exit on the pullback. These traders can also enter when the uptrend breaks and the stock makes a lower low indicating a reversal into a downtrend may be in the cards.
Want direct analysis? Find me in the BZ Pro lounge! Click here for a free trial.
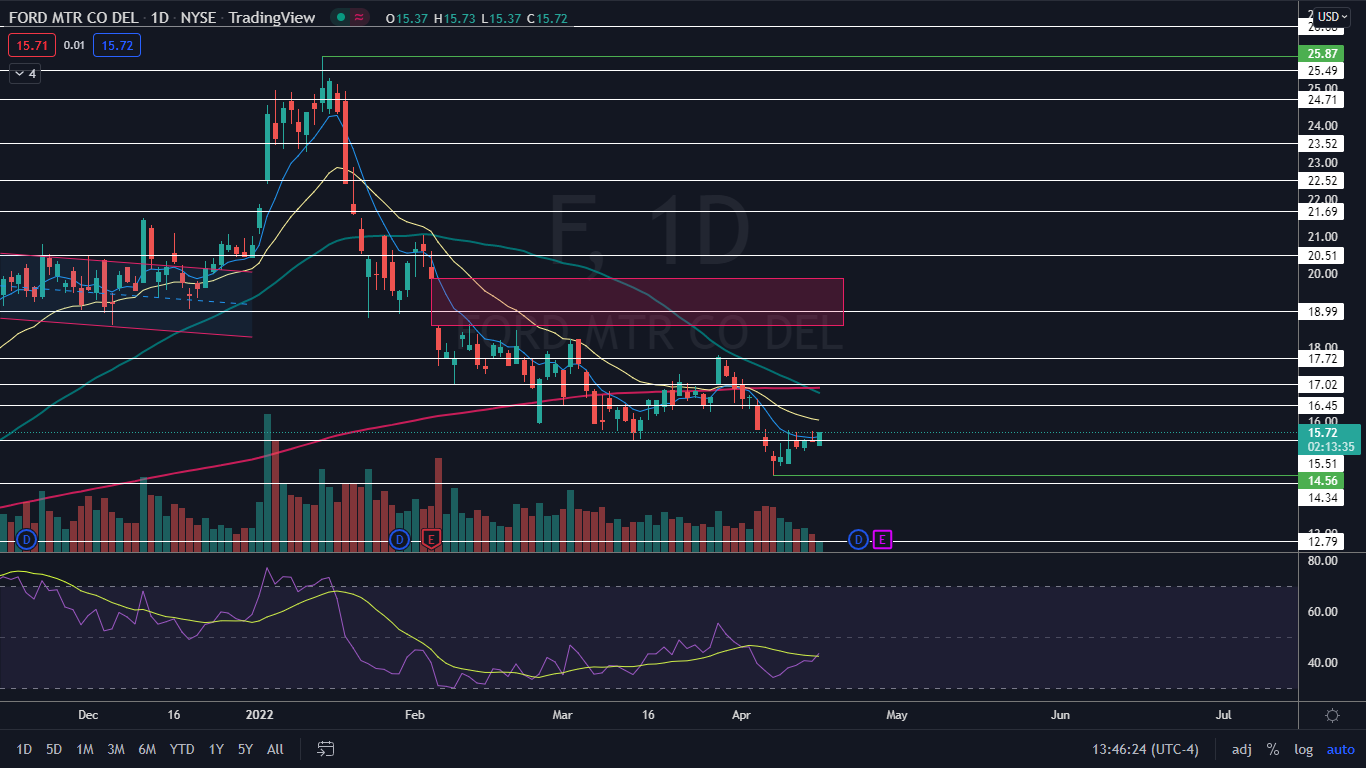
The Ford Chart: Ford reversed into an uptrend on April 7, following a 43.72% decline that brought the stock down from its Jan. 13 high of $25.87 to a low of $14.56. Ford confirmed the uptrend on April 13, when the stock printed a higher low at the $15.22 level.
- If Ford closes the trading day near its high-of-day price, the stock will print a bullish engulfing candlestick on the daily chart, which could indicate higher prices will come again on Tuesday. Bullish traders would like to see Ford close the trading day above the most recent high of $15.77, which will cause the stock to print a higher high to confirm the uptrend is still in play.
- Ford has a gap above on its chart between $18.59 and $19.87. Gaps on charts fill about 90% of the time, which makes it likely Ford will trade up to fill the empty range in the future.
- Bullish traders will want to see Ford rise up above the 200-day simple moving average (SMA), which is trending near the $17 level, in short order because on Friday the 50-day SMA crossed below the 200-day, which caused a death cross to occur. If Ford can rise up above the 200-day quickly, it will cause a golden cross, which would give bullish traders more confidence going forward.
- Ford has resistance above at $16.45 and $17.02 and support below at $15.51 and $14.34.